| GISdevelopment.net ---> AARS ---> ACRS 2000 ---> Coastal Zone Monitoring |
Coastal Zone Environment
Management With Emphasis On Mangrove Ecosystem, A Case Study Of Ao-Sawi
Thung Khla, Chumphon, Thailand
Dr. Surachai
RATANASERMPONG, Ms. Dararat DISBUNCHONG
Remote Sensing Division
National Research Council of Thailand
196 Phaholyothin Rd., Chatuchak, Bangkok 10900
Tel. (66)-2-940-6997 Fax. (66)-2-579-5618
Email: ratana@pop.nrct.go.th
THAILAND
Mr. Thongchai CHARUPPAT, Dr. Suwit ONGSOMWANG
Royal Forest Department
Phaholyothin Rd., Chatuchak, Bangkok 10900
Tel. (66)-2-5799484
Email: technical5@forest.go.th
THAILAND
Key Words : Mangrove ecosystem, Thailand
Abstract
The primary objective of the study on coastal zone environment management with emphasis on mangrove ecosystems was to identify an effective approach for sustainable mangrove forest management using Remote Sensing and GIS technology. The study was conducted by 1) assessing forest land use in 1973, 1987, 1993 and 1998 based on visual interpretation of satellite imagery at the scale of 1:50,000; 2) evaluating forest land use area and change using GIS; and 3) developing a plan for the sustainable forest land use based on additional relevant thematic data.
The major results of this study were the compilation of a relevant thematic database; assessment of forest land use in 1973, 1987, 1993 and 1998; assessment of forest distribution in 1987, 1993 and 1998 as well as the change of land use between 1987-1993 and 1993-1998 and development of a forest land use plan. The mangrove forest can be divided into three principal classes as follows : 1) class I is near to the seashore where the mud is very soft and wet. The dominant species in this class is Avicennia alba and A. officinalis 2) class II It is the are to the first class. The dominant species are Rhizophora apiculata and R. mucronata. 3) class III It is mostly consists of mixed species including Bruguiera cylindrica, Ceriops tagal, Excoecaria agallocha and Xylocarpus granatum.
Introduction
Mangrove forest is one of the most valuable coastal resources, important for its multiple economic, ecological, scientific and culture resources for present, and future generations. It is an important component of Thailand's coastal zone ecosystem. In addition, mangrove forests are utilized as a source of fuelwood and pole production, they provide a nursery and breeding ground for many commercial fish and prawn species. They also protect against coastal erosion and provide a habitat for some protected species of birds and animals.
In recent decades, the coastal zone has been subjected to the effects of a growing population and economic pressure manifested by a variety of activities such as an aquaculture, tin mining, waste disposal, construction and industrialization. Major coastal resources in Thailand, especially mangrove forest, beaches, coral reefs and marine water have been deteriorated or degraded. In addition, the area of mangrove forest in Thailand has decreased rapidly due to the expansion of shrimp farming.
In order to use coastal resources on a sustainable basis, a proper management planning process is necessary. remote sensing and GIS are the major tools for undertaking the plan. Since 1972, Thailand has used a remotely sensed satellite data for assessment of natural resources in many fields, proving that remote sensing is a useful tool for assessing and monitoring the country's coastal resources, especially mangrove forests. Mangrove forest assessment and monitoring has been conducted continuously in Thailand since 1979.
In 1990, high resolution data of Landsat-TM and SPOT-PLA, which can provide more effective information than Landsat-MSS, was used for mangrove forest land use zoning monitoring. It was found that the Landsat-TM bands 4-5-3/R-G-B with linear stretching technique can be used to differentiate mangrove forest from other vegetation and SPOT-PLA shows a better pattern for shrimp farm and built-up areas. In addition, the combination of TM4-TM5-PLA/R-G-B via digital classification can easily depict the mangrove forest zonation which corresponds to the dominant species (Ratanasermpong, S. and C. Silapathong, 1991)
Therefore the integration of remote sensing and GIS for mangrove forest management is considered as an important tool for the development of effective plans by natural resource managers and planners. The main objective of this study is to demonstrate an effective approach for sustainable mangrove forest management by using remote sensing and GIS technology.
Study Area
Ao Sawi - Thung Kha is located between the latitudes 10° 15¢ and 10° 30¢ N and the longitudes 99° 7¢ and 99° 20¢ E, at the mouth of Khlong Sawi and Khlong Thung Kha, in Chumphon province on the south Eastern seaboard of Thailand. It has a total surface area of about 675 sq. km.
The study site has a tropical monsoon climate with two main seasons (wet and dry). The average annual rainfall is 2,010 mm. The peak rainfall month is in November, while the driest month is in March. The wet season is from May to January. The mean annual temperature is 26.90° C, and the highest relative humidity is in October. Tides are diurnal (one high and one low tide a day) with an average amplitude of 1.04 m. The monthly mean sea level is the highest in November and the lowest in March. The monthly discharge from the Chumporn rivers is the highest in August and the lowest in March. The monthly runoff is the highest in November.
The present land use/land cover in the study area is composed of mangrove forest, tropical evergreen forest, freshwater swamp forest, paddy field, rubber plantation, oil palm plantation, mixed orchard, coconut plantation, villages, wetland, wasteland, water bodies and shrimp farms.
Methodology
The main tasks were to classify the forest land use in 1987, 1993 and 1998 based on visual interpretation of satellite imageries at the scale of 1:50,000. The assessment of land use/land cover and change was then conducted using GIS. Finally, the proposal for sustainable forest land use plan was developed based on extracted and relevant thematic data. A schematic flowchart methodology is shown in Figure 1.
Figure 1 Schematic flowchart of the methodology
Analysis Of Gis
Analysis of GIS was performed under vector GIS of PC Arc/Info. Four main outputs were derived based on the complied and extracted geographic databases as follows:
- land use and land cover in 1973, 1987, 1993 and 1998;
- forest distribution in 1993, 1987, 1993 and 1998;
- change in land use and land cover between 1987-1993 and 1993-1998;
The basic techniques employed in the GIS analysis were overlay operation where two layers were input to extract a new layer. For example, for change in land use and land cover change 1987 and 1993, "the two inputs layers were land use and land cover in 1987 and 1993". The new layer was " change of land use and land cover during 1987 and 1993".
Results
The major results are the compilation of relevant thematic databases, assessment of forest land use and forest distribution in 1973, 1987, 1993 and 1998, as well as change in land use and land cover between 1987-1993 and 1993-1998 and development of a proposed forest land use plan.
Assessment of land use/land cover The land use and land cover categories in 1987, 1993 and 1998 were extracted by visual interpretation of satellite images at a scale of 1:50,000. Categories consist of (1) agriculture area; (2) built-up area; (3) forest area; (4) water bodies; (5) wasteland; (6) wetland and (7) shrimp farms. For land use and land cover categories in 1973 directly interpreted from a topographic map at a scale of 1: 50,000 are composed of (1) agriculture area (2) built-up area (3) forest area (4) water bodies (5) wasteland and (6) wetland. The components of land use and land cover in 1973, 1987, 1993 and 1998 are summarized and compared as shown in Table 1.
Table 1 Comparison of land use and land cover
change
| Land use/Land cover Classes | Changed area in ha. | ||
| 1973-1987 | 1987-1993 | 1993-1998 | |
| Agriculture area | 10,050.95 | -1,752.34 | -973.92 |
| Built-up area | 436.56 | 762.70 | -7.94 |
| Forest area | -13,785.30 | -1,976.15 | -237.63 |
| Water bodies | -358.14 | 25.25 | -86.64 |
| Wasteland | 1,944.85 | 721.40 | 845.99 |
| Wetland | -63.81 | 0.00 | 0.00 |
| Shrimp farm | 1,774.89 | 2,219.14 | 460.15 |
Forest Distribution
Based on visual interpretation of satellite imageries at the scale 1:50,000, forest area was further classified into three classes according to the their signature appearance on the image and their characteristics. Major forest types are mangrove, evergreen and freshwater swamp forest. The distributions of forest in 1973, 1987, 1993, 1998 . In addition, mangrove forests are further classified based on crown cover into three classes, namely mangrove with more than 75 % coverage, mangrove with 50-75 % coverage and mangrove with less than 50 % coverage.
The component of forest distribution in 1987, 1993 and 1998 are summarized and compared as shown in Table 2. The characteristics and change of forest classes are described as follows:
- Mangrove with > 75 % coverage. These mangrove forests
mostly consist of Rhizophora apiculata and R. mucronata situated along
the river channels and behind the pioneer species zone(Figure 2). The
extent of mangrove forest with density of more than 75 percent increased
during 1987 to 1998 and covered an area of 290, 488 and 519 ha, in 1987,
1993 and 1989, respectively. The main cause of increasing area is
natural succession and reforestation.
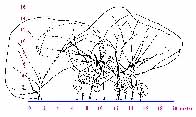
Figure 2 Pioneer species profile - Mangrove with 50-75 % coverage. These mangrove forests mostly
consist of pioneer species, Avicennia alba and A. officinalis situated
on the outer fringe facing the sea (Figure 3). The extent of mangrove
with density more between 50 to 75 percent decreased slightly during
1987 to 1998. These areas covered an area of 1,267, 1,140 and 1,091 ha,
in 1987, 1993 and 1989, respectively. The main cause of decrease is
natural succession by Rhizophora spp. and die back by sand deposit.
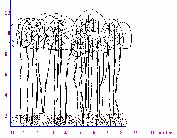
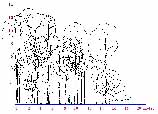
Figure 3 Rhizophora species profile - Mangrove with < 50 % coverage. These mangrove forests
mostly consist of mixed species including Bruguiera cylindrica, Ceriops
tagal, Excoecaria agallocha, Ficus sp., Heritiera littoralis, Hibiscus
tiliaceus, Intsia bijuga, Xylocarpus granatum, and X. moluccensis
situated behind the Rhizophora species zone (Figure 4). The extent of
mangrove with density of less than 50 percent decreased from 1987 to
1998, covering an area of 3,846, 1,900 and 1,696 ha, in 1987, 1993 and
1989, respectively. The main cause the decrease is the expansion of
shrimp farms. Figure 3 Mixed species profile
- Evergreen forest. Evergreen forests situated on the mountainous area decreased from 1987 to 1998. These forests covered an area of 2,691, 2,583 and 2,565 ha, in 1987, 1993 and 1989, respectively. The main cause of the decrease is the expansion of agriculture areas.
- Freshwater swamp forest. This forest mostly consists of Melaleuca leucadendra situated on flat areas behind the mangrove forest. The extent of swamp forest increased during 1987 to 1993 and decreased between 1993 and 1998. This forest type covered an area of 517, 551 and 527 ha, in 1987, 1993 and 1989, respectively.
Table 2 Comparison of forest distribution change between 1987 and 1998
| Forest Distribution Classes | Changed area in ha. | |
| 1993-1987 | 1993-1998 | |
| Mangrove: > 75 % coverage | 197.68 | 31.49 |
| Mangrove: 50-75 % coverage | -127.31 | -49.13 |
| Mangrove: < 50 % coverage | -1,946.10 | -204.45 |
| Tropical evergreen forest | -108.05 | -17.62 |
| Freshwater swamp forest | 34.06 | -24.20 |
| Water bodies | 25.25 | -86.63 |
| Other area | 1,924.47 | 350.55 |
Conclusion
In conclusion remote sensing appears to be a significant tool for assessment and monitoring of coastal zone resources, especially mangrove forest. In addition, planning and management of forest land use is easily and effectively conducted using GIS. However, the integration of remote sensing and GIS for the development of mangrove forest management plans by natural resource managers and planners is necessary.
References
Ratanasermpong, S. and C. Silapathong. 1990. Mangrove Forest Zonation by Using High Resolution Satellite Data. Proceeding of the 11th Asian Conference on Remote Sensing, Guangzhou, China. Volume 1, 6 p.
National Research of Thailand. 1991. Remote Sensing and Mangroves Project (Thailand). Final Report. IDRC/NRCT/RFD. 183 p.
Ongsomwang, S. 1998. Forest Potential Assessment by Using GIS. Forest Resources Assessment Division, Forest Research Office, Royal Forest Department, Bangkok. 69 p. (In Thai).