| GISdevelopment.net ---> AARS ---> ACRS 2000 ---> Coastal Zone Monitoring |
Analysis of the convective
mixing characteristics Of estuarine reservoir by landsat tm images
Takashi
Hoshi
Professor, Department of Computer & Information Sciences,
Ibaraki University, 4-12-1 Nakanarusawa-cho, Hitachi, 316-8511,
Tel: (81)-294 -38-5133 Fax : (81)-294 -38-5282
E-mail: hoshi@cis.ibaraki.ac.jp
JAPAN
Moon Soo Choi
Graduate Student, Graduate School of Science and Engineering,
Ibaraki University, 4-12-1 Nakanarusawa-cho, Hitachi, 316-8511
Tel: (81)-294 -38-5133 Fax : (81)-294 -23-7586
E-mail: moon@cis.ibaraki.ac.jp
JAPAN
Hideyuki Tonooka
Research Associate, Department of Computer & Information Sciences,
Ibaraki University, 4-12-1 Nakanarusawa-cho, Hitachi, 316-8511,
Tel: (81)-294 -38-5149 Fax : (81)-294 -38-5282
E-mail: tonooka@cis.ibaraki.ac.jp
JAPAN
Key Words: Freshening Process, Landsat TM, Atmospheric Correction, Numerical Simulation, Convective Mixing
Abstract
The hydraulic characteristics of the estuarine reservoir constructed in the mouth of a river, which is influenced by the complex mechanisms such as convective mechanism, vertical diffusion, and mixing action in the freshening process. The convective mixing mechanism is the most important element in the freshening of estuarine reservoirs introducing desalted fresh water for the control and improvement of water quality. This paper describes for the convective mixing characteristics using satellite image data and a numerical simulation of flows. The satellite image data consist of two kinds of Landsat TM images acquired in different times separately, which are classified for the study area including the Yongam lake and its bay after the geometric and atmospheric correction processing. These results are also compared to a numerical simulation related to the velocity-vector distribution of influent water and field measurement values that show the temporal variations of water quality in the freshening process. Finally, in the analysis hydraulic characteristics in freshening process, we examined the applied possibility of Landsat TM Image data.
1. Introduction
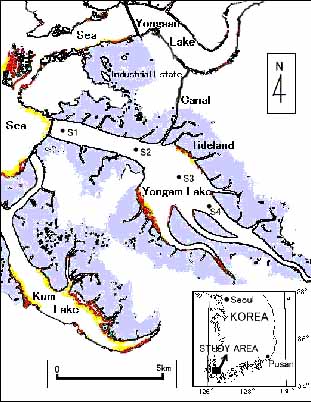
The Yongam lake located in the southwestern coast of the Korean peninsula (Fig.-1), is a standard estuarine reservoir which had been completed on Dec. 31, 1993 as a part of Yongsan river comprehensive agricultural development projects (?-1stage). The hydraulic characteristics of the reservoirs constructed in the estuary, which has been influenced by the complex mechanisms, such as the convective freshening in an upper fresh water layer, the vertical diffusion through a density interface of fresh-salt water, and the mixing action from the bottom soil of a lake. The convective mechanism caused by the mixing of inflows, is very important element in the freshening process of the estuarine reservoir as the Yongam lake introducing desalted fresh water (surplus water) through link canal from adjacent lake.
This article deals with the convective mixing mechanism in the freshening process using Landsat Thematic Mapper(TM), a numerical simulation of flows, and field observations. But, in the use of Landsat image data, three visible bands (485nm, 560nm, and 660nm) observed in the wave length range of visible spectrum have been powerfully affected by the presence of atmosphere, and the analysis of original data becomes difficult. The atmospheric influence must be especially removed in study cases of very small difference of radiance, or surface reflectance or absolute values of temperature, or in researches related to water pollution. And, the atmosphere correction of satellite image data is not much performed because the radiative transfer of electromagnetic wave follows very complicated process.
And then, this study uses the Second Simulation of the Satellite Signal in the Solar Spectrum (6S) of radiative transfer code to make the atmosphere correction possible on the image data without the various information about atmosphere, which is the improved version of 5S developed by the Laboratoire d'Optique Atmospherique. That is a pre-processing process of TM data to analyze the hydraulic characteristics of estuarine reservoir. The corrected data were classified, which were generally compared to the results of the two dimensional numerical simulation of flow fields and field surveys.
2. Study Area And Topographical Characteristics
The study area of this study is the Yongam lake located in the middle of three estuarine reservoir in Yongsan river comprehensive agricultural development projects, as shown in Fig. 1. The enclosure dike of Yongam lake was completed on April 8, 1991. The length of the enclosure dike is 2.2 km while the water resources developed in this desalted lake is 153 million m3 and the water area reclaimed land is 6,730 ha. And the area of the agricultural land adjacent to the water area reclaimed land offered for improvement of irrigation and land consolidation is 5,470 ha. The water resources of Yongam lake is controlled and managed by the management office of Yongam lake opened on May 3, 1994.
The Yongam lake is introducing the desalted fresh water through link canal from Yonsan estuary lake because the river basin is narrow and the inflow is small in comparison to the storage capacity of Yongam lake. The excess water of lake is also recycled as fresh water to desalt the salt water of high concentration in Kum lake. At the present time, the link canal to Kum lake has been completed, the desalinization is progressing well by introducing surplus water desalted from Yongam lake.
In this study, TM bands were cut in the size of 768 lines by 768 pixels after the geometric correction of original data for the areas including three estuarine reservoirs, that is, Yongsan estuary lake, Yongam lake and Kum lake. In the geometric correction, ground control points of TM data are selected on the topographic map of 1:50,000 scale, published in September 1995 in the national geography institute, Korea. The absolute difference between the computed and measured values of the image coordinates was kept down within 1 pixel. The coordinate transformation of which was used Affine transformation equation.
The atmosphere correction in remote sensing that the absorption and the emission of atmospheric energy are regarded as a noise is necessary to correct. The diverse methodologies of atmospheric correction have been proposed. It is classified into three types that consist of the method using radiative transfer code, skylight emission measurements, and regression analysis. The radiative transfer code is used to estimate surface radiance and atmospheric transmittance on the conditions of atmosphere, geometry, and wave number based on radiative transfer equation. The typical codes are MODTRAN (Kneizys et al., 1996) and 6S (Vermote et al., 1994). In addition, the dark object subtract can be also applied when atmospheric affects remove briefly according to study purpose. The method deduct the minimum value of observed DN (Digital Number) values from the image including area that the reflectance is regarded as zero such as wide water area and the shade of clouds. This study uses the radiative transfer code (6S) to execute the atmosphere correction of the image data without a lot of information about atmosphere. When Landsat imagery is used in studies of this nature, there are usually errors associated with the estimation of parameters. The significance of these errors depends on the application of the data. This paper is mainly connected with a synoptic variations in the freshening process of estuarine reservoir, and therefore these errors will not have a significant effect on the objectives of this work (Baban; 1997).
4. Methodology
The study methods of this paper include the water quality observation of field, the simulation of inflow patterns using a numerical analysis, and the processing of Landsat TM images, to analyze the convective mixing patterns of estuarine reservoir.
4.1 Water Quality Observation
The Yongsan river third-stage office of Rural Development Corporation, Korea has been measuring the water quality of lake periodically twice and three times per year since 1991. The salinity has been investigated at the four points of the vicinity of outlet gate (S1), the outlet of link canal (S2), the central part of lake (S3), and the upstream part (S4), along the center line of Yongam lake, as shown in Fig.-1.
4.2 Numerical Simulation of Flow Fields
A simulation related to the mixing patterns of inflows, which is the two-dimensional simulation of flow fields by adopting finite difference method on general curvilinear coordinate system. The various conditions of grid generation in the simulation process were examined, and the temporal variations of horizontal velocity-vector distribution were applied and visualized for the flow fields of final enclosed freshening reservoir.
4.3 Analysis of Satellite Image data
The analysis of TM image data, which is focused and classified for categories such as inflows and stagnant water related to water bodies and convective mixing patterns on the surface of water, after image processing described in the preceding chapter. However, this study was not carried out for a correlation between water quality categories and image data owing to the lack of water quality data.
5. Results And Discussion
5.1 Temporal Variations of Water Quality
The Yongam lake has topographical conditions that is not suitable for freshening because the inflow from watershed is not sufficient to desalt, which is the feature of a standard estuarine reservoir. However, the water depth of lake (6~9m) is shallow relatively except downstream area near outlet gate, maximum depth is approximately 23m. The freshening process is progressing satisfactorily by the introduction of desalted fresh water from adjacent Yongsan lake for desalinization. The salinity that is an important criterion evaluating freshening process has been observed since 1991. Table 1 shows the temporal variations of water quality observed under conditions operated normally by means of desalting facilities as outlet gate, desalt siphons, and suction pumps. These are the results investigated in the downstream (S1) of Yonam lake from Apr. 1994 to Nov. 1996.
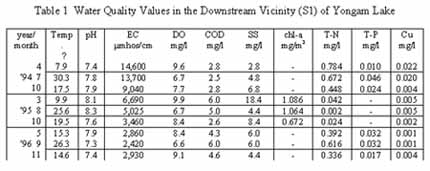
When the inflow of fresh water is increased, the salinity decreases because the mixed salt water with inflow is drained through gates. On the contrary, if the inflow is reduced, the salinity rises by the intrusion of seawater from sea dike and outlet gate, and moreover, the salt water under density interface is also diffused and mixed into upper fresh water layer by density currents. Therefore, it is regarded that the convective phenomenon of inflow affects largely water quality in the freshening process of estuarine reservoir.
5.2 Convective Characteristics of flows
This study was used a numerical scheme based on finite difference method with general curvilinear coordinate system, and was carried out two-dimensional numerical simulation to analyze the convective mixing characteristics of flows in the freshening process. Fig. 2 shows the boundary extracted from TM image and the computational grids generated by adopting the multi-block grid generating method which the inlets (Q1-Q8) were divided into eight places for watershed and outlet (Qg) was fixed in the outlet gate of Yongam lake, respectively. Fig. 3 shows velocity-vector distribution simulated for 24 hours in the conditions (a) without (?t:2) and (b) with (?t:1) the inflow of fresh water and the open of outlet gate.
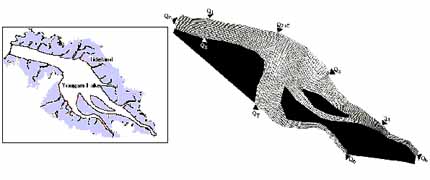
Fig. 2 Boundary of the Study Area Extracted from TM Image and Computational Grids
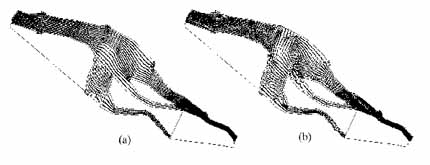
Fig. 3 Velocity-Vector Distribution in Conditions (a) without ( t=24h, ?t:2, Vmax=0.030 m/s) and (b) with ( t=24h, ?t:1, Vmax=0.113 m/s) Desalted Fresh Water
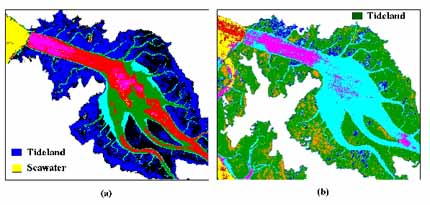
Fig. 4 Classification Images of TM Data Acquired on (a) Sep. 22, 1992 and (b) Sep. 28, 1994
5.3 Mixing Patterns in Freshening Process
Fig. 4 is the images classified using TM data of (a) Sep. 22, 1992 and (b) Sep. 28, 1994, respectively, which clearly shows the different patterns of estuarine reservoir, tideland, and seawater. The convective mixing patterns in freshening reservoir seems to be connected with complicated factors such as a suspended matter and its density, eddies related to inflow velocity, inflow discharge, the diffusion and mixing of density currents, and meteorological parameters et al.. The TM image data as shown in Fig. 4 can be applied to the works on the mixing patterns of convective flows on the surface of water and the environmental changes of tideland (or reclaimed land) changed according to the progress of reclamation projects.
6. Conclusion
The application with satellite image data and numerical analysis in the field of hydraulic engineering, which is considered as a useful way to analyze various hydraulic problems. Finally, it will be supplemented on the presentation for contents have not explained relating to atmospheric correction.
References
Baban, S. M. J., 1997. Environmental Monitoring of Estuaries; Estimating and Mapping Various Environmental Indicators in Breydon Water Estuary, U.K., Using Landsat TM Imagery. Estuarine, Coastal and Shelf Science, 44, pp. 589-598. Choi, M. and Hoshi, T., 2000. Analysis on the Freshening Process of Freshening Reservoir by Desalt Fresh Water, Annual Journal of Hydraulic Engineering, JSCE, 44, pp. 1251-1256. Torii, K. and Hoshi, T. et al., 1996. Investigation on Tidal Land Reclamation in Korea Using Satellite Image Data, Proc. of the 17th ACRS, G-4-1?6,.