| GISdevelopment.net ---> AARS ---> ACRS 2000 ---> AirSar/Master |
A Study of Surface
Deformation From Earthquake by Differential Radar Interferometry
C. T. WANG1, L. S. LIANG2, K. S. CHEN3, A. J. CHEN4
C. T. WANG1, L. S. LIANG2, K. S. CHEN3, A. J. CHEN4
Keywords: Differential Interferometry, Synthetic
Aperture Radar, Surface Deformation, Earthquake
Abstract
We present a mapping of the surface deformation resulting from the 921 earthquake in Central Range of Taiwan using data acquired from ERS/2 high-resolution synthetic aperture radar(SAR) imagery. SAR data sets acquired in January 21, May 6, September 23 and October 28 1999 were processed by differential interferometric technique to generate interferograms from which the deformation is assessed. The coherence between these pairs of interferograms were evaluated for quality check. In addition, the atmosphere effects on the coherence were reduced using sereral sets of interferograms. It is shown that the deformation derived from the interferograms are compared well with GPS measurements by Central Geological Survey (CGS) with interferometric baseline even more than 200m. Results also indicate that the subsidence more than 10cm on the west side of fault area in Taichung is detectable by differential interferometric SAR. It is concluded in this study that the InSAR technique provides a promising tool for detecting crustal deformation by earthquake
1.Assistant Researcher of CSRSR, National Central University
2.Technician of CSRSR, National Central University
3.Professor of CSRSR, National Central University
4.Professor of CSRSR, National Central University
1.Introduction
The purpose of this paper is to utilize the technique of interferometric synthetic aperture radar (IFSAR) to extract information about the crustal deformation after earthquake using the phase content of the complex SAR images, and to detect the land subsidence and crustal movement in Taiwan. SAR not only obtains the radar scattering coefficient of the land cover, but also carries the phase information about the target when a pair of data is conherently processed. The phase has two major parts: the character of the land cover itself and the distance between radar and the target. A single phase echoes essentially bears no information. Therefore, we must have at least one image pair with the same measuring direction and near the same measuring position to examine the difference of echos. If the character of the land cover changes little during the period of images taken, we can ignore the influence of phase caused by it, and then get the radar Interferometric map, produced by the difference of the measuring distance. We then calculate the difference of the distance by using the Interferometric image pairs, and furthermore we use the differential interferogram map with the same area but at different time to calculate the height and the crustal movement. On the development of the relative technology and application, many scholars abroad had researched in this aspect, and the result can be found in many academic periodical. Decorrection in interferometric radar echos has been demonstrated by Howard A. Zebker in 1992 [2]. S. N. Madsen uses airborne synthetic aperture radar interferometry to produce topographic mapping by NASA DC-8 plane in 1993 [3]; and he also presented that accuracy of topographic maps derived from ERS-1 interferometric radar in 1994 [4]. R. M. Goldsten announced satellite radar interferometry: two-dimensional phase unwrapping in 1988 [5]. D. J. Bone published Fourier fringe analysis: the two-dimensional phase unwrapping problem in 1991 [6]. While the application of surface displacement, A. K. Gabtiel ever presented mapping small elevation changes over large areas: differential radar interferometry in 1989 [7]. Massonnet used a map by radar interferometry to check the displacement field of the Landers earthquake in 1993 [8]. Zebker also used differential radar interferometry to derive coseismic displacement in 1994 [9]. Carnec explained two examples of the useage of SAR interferometry on displacement fields of small spatial extent in 1996 [10].
According a report of Central Weather Bureau ( CWB ), a major earthquake ( ML =7.3 ) has occurred near the small town Chi-Chi in the Nantou County, Taiwan, at 1:47 a.m. local time on September 21, 1999 ( 17:47 GMT on 20 September ). The epicenter was 12.5 km northwest the Sun-Moon lake. The focal depth is 8 km. The death toll has exceeded 2100 and is mounting during the first week after the main shock. The Chi-Chi earthquake essentially was resulted from a major reverse fault, the Chelungpu Fault, trending N-S to NNE-SSW, one of the major trust faults in the deformation front of the fold-and-thrust belt of the Taiwan orogenic belt. The movement of the earthquake produced a linear zone of surface ruptures, extending about 80 km long from north to south. According to the in-situ t field investigations, the surface break shows large vertical as well as horizontal displacements, ranged from 1 to 8 meters, along the fault line as a consequence of the Chi-Chi earthquake.
When we reviewed the epicenter distribution during this century, we will get a conclusion that there is a main earthquake zone, which extends to the southeast direction from HouLong ( in MiaoLi County), passing through MiaoLi city, SanYi, ZhuoLan, DongShi, PuLi, SunMoon Lake, and then turning to the southwest direction, passing through ZhuShan, MeiShan, JiaYi, XinYing, Tainan, and forming a wide arc curve seismic zone. This arc curve seismic zone surrounds roughly a stable foundation, which hides in shallow underground of BeiGang, TaiXi, and PengHu. This zone is called BeiGang highlands; it is exactly located in the core area of the inner side in the arc curve seismic zone; relatively, the epicenter of the area distributes fewer, and the earthquake also happens fewer. When the Philippine plate subducts towards the North beneath the Eurasian plate, BeiGang highlands hinder Taiwan island from moving west, as a result, there are some activities of trust faults and earthquakes in the front of mountains; this is the reason that most active faults distribute in the front of mountains[1]. This paper reports the analyzed results for the case of 921 Great Earthquake using differential interferometric SAR technique. Qualitative and quantitative assessments were discussed and compared to field GPS survey.
2. Data Description
In respect of data sources, there are two ways to acquire interferometric SAR pairs: dual pass and dual antenna. Currently, satellite SAR belongs to dual pass, while airborne system such as JPL AIRSAR is kind of dual antenna. This study makes use of ERS SAR data. ERS1 and ERS2 are both earth source satellite, developed by European Space Agency (ESA). They pass over Taiwan at 10:28 am and 10:20 pm. The Center for Space and Remote Sensing Research at National Central University has received and archived quite a large volume of ERS1/2 radar image data since 1993m, providing a very valuable database for interferogram measurement in Taiwan.
We choose the central mountainous area of Taiwan for testing. The ERS satellite orbit no.232, frame 3123 (Figure. 1) was selected to form the image pairs according on the base line term for interferometry provided by ESA. Then, based on the date for the 921 Great Earthquake, data of 21 Jan?6 May?23 Sep and 28 Oct 1999 were singled out for use. The perpendicular and horizontal components of the base lines of these data sets is given in Table 1.
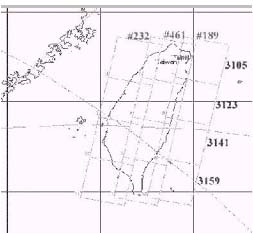
Figure. 1 : Coverage map of ERS2 over Taiwan
Table 1. : the image pair of ERS2 interferometry
3. Data Processing Procedure
The orbit and the observing angle of the ERS satellites are known to be fixed. Hence, it is well suitable for the Interferometry measurements. In another words, it is quite a stable dual pass or repeat pass system. We processed the ERS2 raw signals of these four images (21 Jan,6 May,23 Sep and 28 Oct ) with single look complex(SLC) product. Their coherence maps are respectively displayed in Figure.2 to Figure.5. Noted that the signal data being processed are in complex form, with 16-bit representations for each of the real and imaginary parts, so we can preserve the original phase information. The pixel spacing in slant range and azimuth are 7.9 meters and 3.9 meters, respectively. First we processed the pair of 21 Jan and 6 May before earthquake, and 23 Sep and 28 Oct after earthquake. In view of these two pairs of interference fringes, it can be clearly observed that they are correlated to each other, and there is little atmosphere inference. The differential interference fringes implies the presence of the surface deformation by earthquake. It is noted that the spacing of the fringes is obviously in connection with the base line; great base line has great spacing and vise visa.
We proceed in the way called"Three Pass"by using image from May 6 as reference scene before earthquake, and matching that with 23 Sep and 28 Oct to produce two interferogram images removing the earth curved surface and topography inference. At this point, we still keep working in slant rage coordinate, so that we can subtract with the interferogram images (May 6 and Jan 21) directly to generate two interferometric phase images due to surface deformation, (6 May, 23 Sep) and (6 May, 28 Oct) (Figure.6 and Figure.7 ). Finally, we perform phase restoration in tenth of pixel accuracy to get the surface deformation.
The next step is the image pairs matching each other by conjugate points. Since the orbits are nearly parallel, this kind of images are similar to each other in the geometric characteristic. The conjugate points is best uniformly distributed over the study area and the required number depends on the terrain relief. For this study, about 100 were used. The rms error registration is about 0.1 pixel. Then, the single look complex data is resampled, followed by a 2x10 running window to reduce the speckle noise. The method phase unwrapping is then applied to produce the image of the change of the topography. In this way, the phase error of the interferogram caused by coregistration might be minimized.
4. Results and Discussions
From the coherence maps, there is no interference fringe in the sea due to the lack of coherence. In plain area including town and the suburb area, the vertical component of the base line is about 6 meters with average coherence of above 0.2, in spite of the longest time interval of 175 days ( between 6 May and 28 Oct ). Similarly, for the time interval of 140 days between May 6 and Sep 23, the vertical component of the base line is about 213 meters with average coherence of above 0.2. These may be acceptable for purpose of interferometric detection. By differential interferometry we further get a series of subsidence maps in Taichung city. A maximum scale of about 18 cm after earthquake was estimated, which compare fairly well with GPS measurement [1].
To make sense of the comparison, we carefully investigated and checked the GPS measurement along fault broken zone. From the great earthquake resulted in the obvious bulge along the Chelungpu fault, we calculated the measurement of the fault broken zone which has both historical meaning and practical value that leads the Central Geological Survey(CGS) to give every effort to survey the fault belt ( zone ). In order to make sure the position of the surface rupture of fault, CGS has confirmed the position of outcrop by in-situ field measurements. Trimble 4000 SSi receiver was used in the survey of the fault broken line(zone) by means of fast static survey method, with one or two the GPS stake set by CGS as reference station. Processing along the fault zone by 4 or 5 moving GPS station was conducted with receiving signals sampled at every 5 seconds for 8 to 15 minutes. Depending on the field of view of the GPS station, each critical outcrop had been measured except in mountainous area where it was difficult, if not impossible, to be tracked. After data taken, the base line precision was confirmed to be under 10 cm [10] for the distance in between 3 and 60 kilometers from reference station.
The GPS network measurement shows that between the north Tunzijiao fault and Yuanli it arises 4 to 8 cm in vertical displacement component; it descended 11 to 22 cm in the west of ChangHua fault. Among the east of ChungHua fault, the west of Chelungpu fault, and the south of Caotun, a 18 to 22 cm decending was observed. And in the north of Caotun, there was a 8 to 18 cm descending, while between the east of Chelungpu fault and Shuangdong fault, it arises 1.5 to 4 meters. It was even greater near the Chelungpu fault; in the east part of Shuangdong fault appears about 1 meter arising; and the position of geography center of Taiwan moved 2.3 meters in northwest direction with descending of 63 cm in vertical
To this end, it may be recalled that the differential interferometry is measuring movemen in centimeter scale. When the vertical displacement is too large such as those analyzed above, the interferometric coherence was almost lost, making the deformation detection very difficult. The Chelungpu fault, for example, presented a displacement amount to meters. C band system like ERS is not appropriate. We must consider the radar system of the L band like JERS-1 having longer wavelength.
5. Summary
Some conclusions are reached based the case study in this paper:
We would like to thank Dr. Kuo-Fong Ma ( Institute of Geophysics, National Central University, Chung-Li, Taiwan, ROC ), Dr. Shui-Bei Yu ( Institute of Earth Science, Academia Sinica, Nankang, Taiwan, ROC ), the GPS surveying data after earthquake was supplied by the Central Geological Survey ( CGS ). We are also indebted to all the staff members of CSRSR who processed ERS and SPOT images used in this study.
6. References
Abstract
We present a mapping of the surface deformation resulting from the 921 earthquake in Central Range of Taiwan using data acquired from ERS/2 high-resolution synthetic aperture radar(SAR) imagery. SAR data sets acquired in January 21, May 6, September 23 and October 28 1999 were processed by differential interferometric technique to generate interferograms from which the deformation is assessed. The coherence between these pairs of interferograms were evaluated for quality check. In addition, the atmosphere effects on the coherence were reduced using sereral sets of interferograms. It is shown that the deformation derived from the interferograms are compared well with GPS measurements by Central Geological Survey (CGS) with interferometric baseline even more than 200m. Results also indicate that the subsidence more than 10cm on the west side of fault area in Taichung is detectable by differential interferometric SAR. It is concluded in this study that the InSAR technique provides a promising tool for detecting crustal deformation by earthquake
1.Assistant Researcher of CSRSR, National Central University
2.Technician of CSRSR, National Central University
3.Professor of CSRSR, National Central University
4.Professor of CSRSR, National Central University
1.Introduction
The purpose of this paper is to utilize the technique of interferometric synthetic aperture radar (IFSAR) to extract information about the crustal deformation after earthquake using the phase content of the complex SAR images, and to detect the land subsidence and crustal movement in Taiwan. SAR not only obtains the radar scattering coefficient of the land cover, but also carries the phase information about the target when a pair of data is conherently processed. The phase has two major parts: the character of the land cover itself and the distance between radar and the target. A single phase echoes essentially bears no information. Therefore, we must have at least one image pair with the same measuring direction and near the same measuring position to examine the difference of echos. If the character of the land cover changes little during the period of images taken, we can ignore the influence of phase caused by it, and then get the radar Interferometric map, produced by the difference of the measuring distance. We then calculate the difference of the distance by using the Interferometric image pairs, and furthermore we use the differential interferogram map with the same area but at different time to calculate the height and the crustal movement. On the development of the relative technology and application, many scholars abroad had researched in this aspect, and the result can be found in many academic periodical. Decorrection in interferometric radar echos has been demonstrated by Howard A. Zebker in 1992 [2]. S. N. Madsen uses airborne synthetic aperture radar interferometry to produce topographic mapping by NASA DC-8 plane in 1993 [3]; and he also presented that accuracy of topographic maps derived from ERS-1 interferometric radar in 1994 [4]. R. M. Goldsten announced satellite radar interferometry: two-dimensional phase unwrapping in 1988 [5]. D. J. Bone published Fourier fringe analysis: the two-dimensional phase unwrapping problem in 1991 [6]. While the application of surface displacement, A. K. Gabtiel ever presented mapping small elevation changes over large areas: differential radar interferometry in 1989 [7]. Massonnet used a map by radar interferometry to check the displacement field of the Landers earthquake in 1993 [8]. Zebker also used differential radar interferometry to derive coseismic displacement in 1994 [9]. Carnec explained two examples of the useage of SAR interferometry on displacement fields of small spatial extent in 1996 [10].
According a report of Central Weather Bureau ( CWB ), a major earthquake ( ML =7.3 ) has occurred near the small town Chi-Chi in the Nantou County, Taiwan, at 1:47 a.m. local time on September 21, 1999 ( 17:47 GMT on 20 September ). The epicenter was 12.5 km northwest the Sun-Moon lake. The focal depth is 8 km. The death toll has exceeded 2100 and is mounting during the first week after the main shock. The Chi-Chi earthquake essentially was resulted from a major reverse fault, the Chelungpu Fault, trending N-S to NNE-SSW, one of the major trust faults in the deformation front of the fold-and-thrust belt of the Taiwan orogenic belt. The movement of the earthquake produced a linear zone of surface ruptures, extending about 80 km long from north to south. According to the in-situ t field investigations, the surface break shows large vertical as well as horizontal displacements, ranged from 1 to 8 meters, along the fault line as a consequence of the Chi-Chi earthquake.
When we reviewed the epicenter distribution during this century, we will get a conclusion that there is a main earthquake zone, which extends to the southeast direction from HouLong ( in MiaoLi County), passing through MiaoLi city, SanYi, ZhuoLan, DongShi, PuLi, SunMoon Lake, and then turning to the southwest direction, passing through ZhuShan, MeiShan, JiaYi, XinYing, Tainan, and forming a wide arc curve seismic zone. This arc curve seismic zone surrounds roughly a stable foundation, which hides in shallow underground of BeiGang, TaiXi, and PengHu. This zone is called BeiGang highlands; it is exactly located in the core area of the inner side in the arc curve seismic zone; relatively, the epicenter of the area distributes fewer, and the earthquake also happens fewer. When the Philippine plate subducts towards the North beneath the Eurasian plate, BeiGang highlands hinder Taiwan island from moving west, as a result, there are some activities of trust faults and earthquakes in the front of mountains; this is the reason that most active faults distribute in the front of mountains[1]. This paper reports the analyzed results for the case of 921 Great Earthquake using differential interferometric SAR technique. Qualitative and quantitative assessments were discussed and compared to field GPS survey.
2. Data Description
In respect of data sources, there are two ways to acquire interferometric SAR pairs: dual pass and dual antenna. Currently, satellite SAR belongs to dual pass, while airborne system such as JPL AIRSAR is kind of dual antenna. This study makes use of ERS SAR data. ERS1 and ERS2 are both earth source satellite, developed by European Space Agency (ESA). They pass over Taiwan at 10:28 am and 10:20 pm. The Center for Space and Remote Sensing Research at National Central University has received and archived quite a large volume of ERS1/2 radar image data since 1993m, providing a very valuable database for interferogram measurement in Taiwan.
We choose the central mountainous area of Taiwan for testing. The ERS satellite orbit no.232, frame 3123 (Figure. 1) was selected to form the image pairs according on the base line term for interferometry provided by ESA. Then, based on the date for the 921 Great Earthquake, data of 21 Jan?6 May?23 Sep and 28 Oct 1999 were singled out for use. The perpendicular and horizontal components of the base lines of these data sets is given in Table 1.
Figure. 1 : Coverage map of ERS2 over Taiwan
Table 1. : the image pair of ERS2 interferometry
| The date of the master image | The date of the slave image | The interval of the date | Perpendicular base line | Horizontal base line |
| 99/05/06 | 99/01/21 | 105 | -96m | -91m |
| 99/10/28 | 99/09/23 | 35 | 219m | 91m |
| 99/05/06 | 99/09/23 | 140 | 213m | 54m |
| 99/05/06 | 99/10/28 | 175 | -6m | 37m |
3. Data Processing Procedure
The orbit and the observing angle of the ERS satellites are known to be fixed. Hence, it is well suitable for the Interferometry measurements. In another words, it is quite a stable dual pass or repeat pass system. We processed the ERS2 raw signals of these four images (21 Jan,6 May,23 Sep and 28 Oct ) with single look complex(SLC) product. Their coherence maps are respectively displayed in Figure.2 to Figure.5. Noted that the signal data being processed are in complex form, with 16-bit representations for each of the real and imaginary parts, so we can preserve the original phase information. The pixel spacing in slant range and azimuth are 7.9 meters and 3.9 meters, respectively. First we processed the pair of 21 Jan and 6 May before earthquake, and 23 Sep and 28 Oct after earthquake. In view of these two pairs of interference fringes, it can be clearly observed that they are correlated to each other, and there is little atmosphere inference. The differential interference fringes implies the presence of the surface deformation by earthquake. It is noted that the spacing of the fringes is obviously in connection with the base line; great base line has great spacing and vise visa.
We proceed in the way called"Three Pass"by using image from May 6 as reference scene before earthquake, and matching that with 23 Sep and 28 Oct to produce two interferogram images removing the earth curved surface and topography inference. At this point, we still keep working in slant rage coordinate, so that we can subtract with the interferogram images (May 6 and Jan 21) directly to generate two interferometric phase images due to surface deformation, (6 May, 23 Sep) and (6 May, 28 Oct) (Figure.6 and Figure.7 ). Finally, we perform phase restoration in tenth of pixel accuracy to get the surface deformation.
The next step is the image pairs matching each other by conjugate points. Since the orbits are nearly parallel, this kind of images are similar to each other in the geometric characteristic. The conjugate points is best uniformly distributed over the study area and the required number depends on the terrain relief. For this study, about 100 were used. The rms error registration is about 0.1 pixel. Then, the single look complex data is resampled, followed by a 2x10 running window to reduce the speckle noise. The method phase unwrapping is then applied to produce the image of the change of the topography. In this way, the phase error of the interferogram caused by coregistration might be minimized.
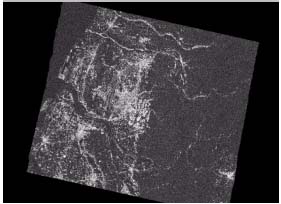
Figure2: The Coherence map on May 6 and Jan 21 |
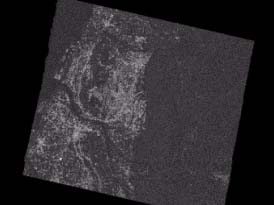
Figure3: The Coherence map on May 6 and Sep 23 |

Figure. 4: The Coherence map on May 6 and Oct 28 |
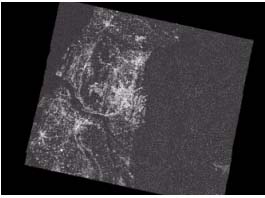
Figure. 5: The Coherence map on Sep 23 and Oct 28 |
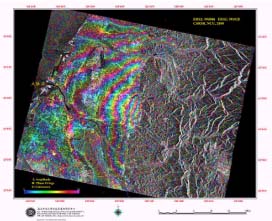
Figure. 6: The differential interferogram on May 6 and Sep 23 |
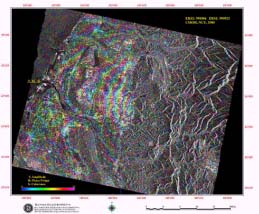
Figure. 7: The differential interferogram on May 6 and Oct 28 |
4. Results and Discussions
From the coherence maps, there is no interference fringe in the sea due to the lack of coherence. In plain area including town and the suburb area, the vertical component of the base line is about 6 meters with average coherence of above 0.2, in spite of the longest time interval of 175 days ( between 6 May and 28 Oct ). Similarly, for the time interval of 140 days between May 6 and Sep 23, the vertical component of the base line is about 213 meters with average coherence of above 0.2. These may be acceptable for purpose of interferometric detection. By differential interferometry we further get a series of subsidence maps in Taichung city. A maximum scale of about 18 cm after earthquake was estimated, which compare fairly well with GPS measurement [1].
To make sense of the comparison, we carefully investigated and checked the GPS measurement along fault broken zone. From the great earthquake resulted in the obvious bulge along the Chelungpu fault, we calculated the measurement of the fault broken zone which has both historical meaning and practical value that leads the Central Geological Survey(CGS) to give every effort to survey the fault belt ( zone ). In order to make sure the position of the surface rupture of fault, CGS has confirmed the position of outcrop by in-situ field measurements. Trimble 4000 SSi receiver was used in the survey of the fault broken line(zone) by means of fast static survey method, with one or two the GPS stake set by CGS as reference station. Processing along the fault zone by 4 or 5 moving GPS station was conducted with receiving signals sampled at every 5 seconds for 8 to 15 minutes. Depending on the field of view of the GPS station, each critical outcrop had been measured except in mountainous area where it was difficult, if not impossible, to be tracked. After data taken, the base line precision was confirmed to be under 10 cm [10] for the distance in between 3 and 60 kilometers from reference station.
The GPS network measurement shows that between the north Tunzijiao fault and Yuanli it arises 4 to 8 cm in vertical displacement component; it descended 11 to 22 cm in the west of ChangHua fault. Among the east of ChungHua fault, the west of Chelungpu fault, and the south of Caotun, a 18 to 22 cm decending was observed. And in the north of Caotun, there was a 8 to 18 cm descending, while between the east of Chelungpu fault and Shuangdong fault, it arises 1.5 to 4 meters. It was even greater near the Chelungpu fault; in the east part of Shuangdong fault appears about 1 meter arising; and the position of geography center of Taiwan moved 2.3 meters in northwest direction with descending of 63 cm in vertical
To this end, it may be recalled that the differential interferometry is measuring movemen in centimeter scale. When the vertical displacement is too large such as those analyzed above, the interferometric coherence was almost lost, making the deformation detection very difficult. The Chelungpu fault, for example, presented a displacement amount to meters. C band system like ERS is not appropriate. We must consider the radar system of the L band like JERS-1 having longer wavelength.
5. Summary
Some conclusions are reached based the case study in this paper:
- The most severe land subsidence of Taichung city was estimated to be about 18 cm. Comparison with the GPS surveying data confirms that the InSAR and GPS results have in the same sinking tendency, suggesting that the differential interferometry has great potential for detecting the displacement in large area.
- If the displacement is too large in vertical part, the coherence of the image pairs is too low, then we can't detect possible surface deformation. A system with longer wavelength might be a solution. Besides, the phase noise due to the vegetation cover can be reduced.
- The influence of atmospheric and ionospheric effects in interferogram should be taken into account. One solution is using GPS network observations to remove such effetcs. Another way is to increase the numbers of monitoring. In this paper, the ERSs' data are all in descending mode, the change in distance being in slant range. Thus, it is not possible to separate the horizontal and perpendicular component. If we acquire the data in ascending mode data in the future, we may analyze the components of change.
- The complete detecting task of long-term and large area of surface deformation depends greatly on continuity of the image data receiving. Also, a large volume of SAR data archive is essential for long term displacement monitoring as well as short term displacement by natural disaster such as earthquake. The GPS survey is good for a point by point, but not cost effective for extensive area. The interferometric SAR technique and GPS are complementary and supplementary to each other.
- The ground resolution of ERS satellite series is 20 meters now, and its incident angle is fixed to 23°, so image of mountainous area has many layovers and shadows. We should have choice for higher resolution and flexible incident angle, such as Radersat-1 or Radersat-2, to minimize the amount of layovers and shadows.
We would like to thank Dr. Kuo-Fong Ma ( Institute of Geophysics, National Central University, Chung-Li, Taiwan, ROC ), Dr. Shui-Bei Yu ( Institute of Earth Science, Academia Sinica, Nankang, Taiwan, ROC ), the GPS surveying data after earthquake was supplied by the Central Geological Survey ( CGS ). We are also indebted to all the staff members of CSRSR who processed ERS and SPOT images used in this study.
6. References
- Zhao-Xia Chen(1999), the survey reports of 921 earthquake and geology, Central Geological Survey, Department of Economy, Taiwan.
- Goldsten, R.M., Zebker, H. A., and Werner, C. L.(1988),Satellite radar interferometry: Two-dimensional phase unwrapping,Radio Science,Vol. 23,No. 4,pp. 713-720.
- Gabtiel, A. K., Goldstein, R. M., and Zebker, H. A.(1989), Mapping small elevation changes over large areas: Differential radar Interferometry, j. Geophys. Res., Vol. 94, No. B7, pp. 9183-9191.
- Bone, D. J.(1991), Fourier fringe analysis: the two-dimensional phase unwrapping problem, Applied Optics, Vol. 30, No. 25, pp. 3627-3632.
- Zekber, H. A., and Villasenor, J.(1992), Decorrelation in interferometric radar echoes, IEEE Trans. Geosci. Remote Sensing, Vol.30., No. 5, pp.950-959.
- Madsen, S. N., Zebker, H. A., and Martin, J.(1993), Topographic mapping using radar interferometry: Processing techniques, IEEE Trans. Geosci. Remote Sensing, Vol. 31, No. 1, pp. 246-256.
- Massonnet, D., Rossi, M., Carmona, C., Adragna, F., Peitzer, G., Feigi, K., and Rabaute, T.(1993), The displacement field of the Landers earthquake mapped by radar interferometry, Nature, Vol. 364, No. 8, pp. 138-142.
- Zekber, H. A., Werner, C. L., Rosen, P. A., and Hensley, S.(1994), Accuracy of topographic maps derived from ERS-1 interferometric radar, IEEE Trans. Geosci. Remote Sensing, Vol. 32, No. 4, pp. 823-836.
- Zekber, H. A., Rosen, P. A., Goldstein,R. M., Gabriel,A., and Werner,C. L. (1994), On the derivation of coseismic displacement fields using differential radar interferometry: The Landers earthquake, J, Geophy., Vol. 99, No. B10, pp. 19.617-19.634.
- Carnec. C.,Massonnet D. and King C.(1996), Two examples of the use of SAR interferometry on displacement fields of small spatial extent, Geophy. Res., Vol. 23, No. 24, pp. 3579-3582.
- Hui-Zheng Zhang(1999), the survey reports of 921 earthquake and geology, Central Geological Survey, Department of Economy, Taiwan.