| GISdevelopment.net ---> AARS ---> ACRS 2000 ---> AirSar/Master |
Analysis of Polarization
Signatures and Textural Features for Airborne Pi-Sar Images
Takahiro YAMADA
Graduate School of Science and Engineering,
Ibaraki University
4-12-1 Nakanarusawa, Hitachi, Ibaraki, 316-8511, Japan
Tel: (81)-294-38-8235, Fax: (81)-294-38-5282
E-MAIL : yamada@fukushima-nct.ac.jp
Takashi HOSHI
Professor, Department of the Computer and Information Sciences,
Faculty of Engineering, Ibaraki University
4-12-1 Nakanarusawa, Hitachi, Ibaraki, 316-8511, Japan
Tel: (81)-294-38-5133, Fax: (81)-294-38-5282
E-MAIL : hoshi@cis.ibaraki.ac.jp
Keywords: Polarization Signature, Textural
Feature, PI-SAR
Abstract
For high resolution SAR images, the influences of the factors that can be ignored for usual SAR images, such as the shadows of buildings and trees, have to consider. In this paper, the influences of the factors particular to high resolution images for polarization signatures and textural features, and the changes by the differences of wavelength are analyzed using PI-SAR images.
1. Introduction Recently, resolution of remote sensing image data has been higher, and the tendency has been seen not only for visible sensor images but also for Synthetic Aperture Radar (SAR) images. For the observations of earth using SAR, to observe the detailed physical properties for the surfaces has been possible by polarimetry technique, and various products have been reported [1],[2]. Analysis of polarization signatures, one of general methods for the analysis of polarimetric SAR images, has been expressed in many papers and shown its availability [3]. Textural analysis has also been carried out for polarimetric SAR [4],[5]. However, it is scarcely discussed that changes polarization signatures and textural features caused by improvement of the resolution.
In this study, the influences carried by the shadows of buildings and trees that have never been considered in usual resolution polarimetric SAR (SIR-C and so on) are analyzed using airborne PI-SAR (Polarimetric and Interferometric SAR) high resolution images. In general resolution SAR images, the shadow effect should be considered for the analysis of mountain areas. For these images, the shadows of buildings and trees had been ignored because their sizes were smaller than limits of resolutions. However, unusual surface patterns are formed clearly due to the fine shadow included the analysis areas using higher resolution images. The influences of back-scattering coefficients for the patterns are compared using polarization signatures and the influences of image structures are analyzed using textural features. For PI-SAR data, the resolution varies according to the frequency band (X-band or L-band), so that the resolutions are transformed the same value and the differences among wavelength are also discussed.
2. Pi-Sar Data
PI-SAR is one of airborne SAR developed by CRL and NASDA for the purpose of observing earth environment and watching disasters [6],[7]. Its observation frequency band are X-band (9.55 [GHz]) and L-band (1.27 [GHz]), and the resolutions vary according to the wavelength; 1.5 [m] and 3.0 [m] respectively. In distributed PI-SAR data products, there are SSC (Single-look Slantrange Complex), MGA (Multi-look Groundrange Complex), and MGP (Multi-look Groundrange Polarimetric) formats. In this study, MGP format data was selected because this format data has full-polarimetric information. For each pixel, the polarization information expressed by 10 byte data.
As the object areas, vegetation area and residential area were mainly extracted. In these areas, though shadows of trees and buildings appear scarcely, the changes of pattern influenced by the shadows should be considered for high resolution sensor like PI-SAR. The overview of PI-SAR data used in this study is shown in Table 1, and the sizes of extracted areas are shown in Table 2 respectively. Fig.1 shows the positions of these areas in used scene.
Table 1: Overview of used PI-SAR data
Table 2: Sizes of extracted areas (Unit: pixels)
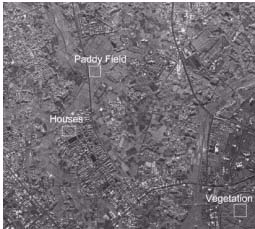
Fig.1: Extracted areas in Tsukuba site (X-band HH polarization image)
© Communication Research Laboratory 1999.
3. Analysis of Polarization Signatures for the Targets
The first, complex scattering matrices were derived from PI-SAR MGP data for each pixel to make polarization signatures that indicate the polarization properties of scattering intensity of microwave for the target. Next, the complex scattering matrices were transformed Mueller matrices constructed by real number elements, and obtained matrices were averaged in homogeneous area to reduction influences of speckle noises. Generally, polarization signatures are obtained from averaged Mueller matrices. Polarization signature diagrams represent the value of polarization signatures graphically, and these shapes characterize the targets [1]~[3],[8].
In SAR images, it is well known to undergo the influences of shadows that appear scarcely in the images obtained by the sensor observing directly below. Particularly, in high resolution SAR image, including the shadows in extracted sample areas is liable to occur. In the following description, the fluctuations of polarization signatures between the area including shadows and the area excluding them are investigated [9].
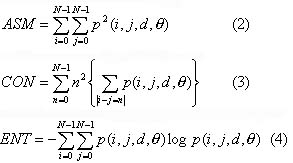
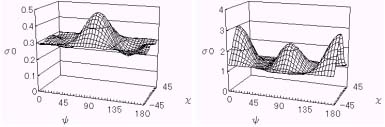
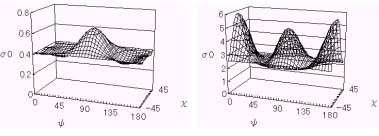
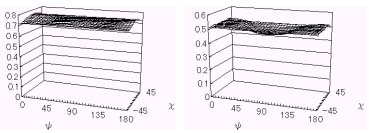
Fig.2 shows the polarization signature diagrams of vegetation area and residential area including shadows, and Fig.3 shows the ones of the same areas excluding them. These diagrams were obtained from high resolution X-band data, and combination of polarization was co-polarization. Although influence of shadows for the shape of polarization signature diagrams was little, it was found that the reciprocity value of s0 for including shadows area was smaller than for excluding shadow area. Then we estimated the polarization signature ratio of including shadow to excluding one. Fig.4 shows that the dependence of the ratio of s0 was small, and it was nearly certain.
Fig.2: Polarization signature diagrams for extracted area including shadows
Fig.3: Polarization signature diagrams for extracted area excluding shadows
Fig.4: The polarization signature ratio of including shadow to excluding one
4. Analysis of Textural Features for the
Targets
In the next place, we estimated textural features from the same areas analyzed polarization signatures. For PI-SAR data, it is difficult to compare as it stands because the resolutions depend on the observation frequencies (X and L-band). Hence two kinds of sub-images were compared for X-band data. One of them was the features derived from normal pixel spacing images, another one was derived from thinned out images to match the resolution to L-band image data. Furthermore, features of thinned out X-band images are compared with the features of L-band normal pixel spacing images [10].
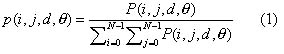
In this study, GLCM (Gray Level Co-occurrence Matrix) method was used to estimate textural features. In this method, textures are defined from distances and directions of neighbor two pixels. Some textural features derived by this method are proposed, Angular Second Moment (ASM), Contrast (CON), Entropy (ENT), and so on [9],[11],[12]. Each element of GLCM is expressed as P(i, j, d, q ), and it is changed into probability variable p(i, j, d, q ) by equation (1) to derive the textural features.
To analyze the difference by frequency band, the feature property diagram for the same area of L-band normal pixel spacing image data is shown Fig.6.
Fig.5: Polarization properties for X-band residential area image
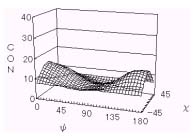
Fig.6: Polarization property diagram for residential area of L-band normal pixel spacing image
5. Discussions
The first, fluctuations of polarization signatures caused by including shadows in partial area are considered. Back-scattering for the shadow is much smaller, so that the elements of Mueller matrix are also smaller wholly. Hence, averaged values of the elements are smaller than the area excluding shadows relatively. Therefore, values of s0 become smaller, too. On the other hand, the shapes of polarization signature diagrams are preserved because back-scattering for shadows depend on the polarization scarcely.
Next, the polarization properties of textural features are considered. For the textural features like contrast that depend on the intensity of the change of gray level in partial area, feature values decreased for thinned images. Especially, in the residential area, though the minimum value was around VV polarization for normal pixel spacing images, the minimum was around HH polarization for thinned images. Hence, we found differences of the pattern caused by resolution appear in the same area images, and these influence polarization properties. Textures were changed by the wave-length, we consider that was caused by the relationship between wave-length with the size and arrangement of targets.
6. Conclusions
In this study, the fluctuations of polarization signatures and textural features for the situation including shadow in the objective areas using high resolution PI-SAR images. For polarization signature, the value of s0 decreased relatively by including shadow, dependence on polarization was preserved. On the other hand, for textural feature, the change appeared in the polarization properties. Therefore, to analyze high resolution SAR images, the rate of shadow in objective area should be considered. For more land-cover pattern, this research is needed to advance.
Acknowledgment
The authors would like to thank Dr. Masaharu FUJITA, Professor of Tokyo Metropolitan Institute of Technology, Makoto SATAKE and Dr. Tatsuharu KOBAYASHI, Senior research official of Communications Research Laboratory, Ministry of Posts and Telecommunications, offered the data of PI-SAR.
References
Abstract
For high resolution SAR images, the influences of the factors that can be ignored for usual SAR images, such as the shadows of buildings and trees, have to consider. In this paper, the influences of the factors particular to high resolution images for polarization signatures and textural features, and the changes by the differences of wavelength are analyzed using PI-SAR images.
1. Introduction Recently, resolution of remote sensing image data has been higher, and the tendency has been seen not only for visible sensor images but also for Synthetic Aperture Radar (SAR) images. For the observations of earth using SAR, to observe the detailed physical properties for the surfaces has been possible by polarimetry technique, and various products have been reported [1],[2]. Analysis of polarization signatures, one of general methods for the analysis of polarimetric SAR images, has been expressed in many papers and shown its availability [3]. Textural analysis has also been carried out for polarimetric SAR [4],[5]. However, it is scarcely discussed that changes polarization signatures and textural features caused by improvement of the resolution.
In this study, the influences carried by the shadows of buildings and trees that have never been considered in usual resolution polarimetric SAR (SIR-C and so on) are analyzed using airborne PI-SAR (Polarimetric and Interferometric SAR) high resolution images. In general resolution SAR images, the shadow effect should be considered for the analysis of mountain areas. For these images, the shadows of buildings and trees had been ignored because their sizes were smaller than limits of resolutions. However, unusual surface patterns are formed clearly due to the fine shadow included the analysis areas using higher resolution images. The influences of back-scattering coefficients for the patterns are compared using polarization signatures and the influences of image structures are analyzed using textural features. For PI-SAR data, the resolution varies according to the frequency band (X-band or L-band), so that the resolutions are transformed the same value and the differences among wavelength are also discussed.
2. Pi-Sar Data
PI-SAR is one of airborne SAR developed by CRL and NASDA for the purpose of observing earth environment and watching disasters [6],[7]. Its observation frequency band are X-band (9.55 [GHz]) and L-band (1.27 [GHz]), and the resolutions vary according to the wavelength; 1.5 [m] and 3.0 [m] respectively. In distributed PI-SAR data products, there are SSC (Single-look Slantrange Complex), MGA (Multi-look Groundrange Complex), and MGP (Multi-look Groundrange Polarimetric) formats. In this study, MGP format data was selected because this format data has full-polarimetric information. For each pixel, the polarization information expressed by 10 byte data.
As the object areas, vegetation area and residential area were mainly extracted. In these areas, though shadows of trees and buildings appear scarcely, the changes of pattern influenced by the shadows should be considered for high resolution sensor like PI-SAR. The overview of PI-SAR data used in this study is shown in Table 1, and the sizes of extracted areas are shown in Table 2 respectively. Fig.1 shows the positions of these areas in used scene.
| Subject | X-band data | L-band data |
| Frequency [GHz] | 9.55 | 1.27 |
| Azimuth resolution [m] | 1.5 / 3.0 | 3.0 |
| Range resolution [m] | 1.5 / 3.0 | 3.0 |
| Data format | Multi-look Grouondrange Polarimetric | |
| Observation site | Tsukuba, Japan | |
| Acquisition date | 1997. 9. 30 | |
Table 2: Sizes of extracted areas (Unit: pixels)
| Name of area | Azimuth orientation | Range orientation |
| Paddy field | 140 | 140 |
| Vegetation area | 160 | 160 |
| Residential area | 170 | 130 |
Fig.1: Extracted areas in Tsukuba site (X-band HH polarization image)
© Communication Research Laboratory 1999.
The first, complex scattering matrices were derived from PI-SAR MGP data for each pixel to make polarization signatures that indicate the polarization properties of scattering intensity of microwave for the target. Next, the complex scattering matrices were transformed Mueller matrices constructed by real number elements, and obtained matrices were averaged in homogeneous area to reduction influences of speckle noises. Generally, polarization signatures are obtained from averaged Mueller matrices. Polarization signature diagrams represent the value of polarization signatures graphically, and these shapes characterize the targets [1]~[3],[8].
In SAR images, it is well known to undergo the influences of shadows that appear scarcely in the images obtained by the sensor observing directly below. Particularly, in high resolution SAR image, including the shadows in extracted sample areas is liable to occur. In the following description, the fluctuations of polarization signatures between the area including shadows and the area excluding them are investigated [9].
Fig.2 shows the polarization signature diagrams of vegetation area and residential area including shadows, and Fig.3 shows the ones of the same areas excluding them. These diagrams were obtained from high resolution X-band data, and combination of polarization was co-polarization. Although influence of shadows for the shape of polarization signature diagrams was little, it was found that the reciprocity value of s0 for including shadows area was smaller than for excluding shadow area. Then we estimated the polarization signature ratio of including shadow to excluding one. Fig.4 shows that the dependence of the ratio of s0 was small, and it was nearly certain.
 | |
| (a) Vegetation area | (a) (b) Residential area |
Fig.2: Polarization signature diagrams for extracted area including shadows
 | |
| (a) Vegetation area | (a) (b) Residential area |
Fig.3: Polarization signature diagrams for extracted area excluding shadows
 | |
| (a) Vegetation area | (a) (b) Residential area |
Fig.4: The polarization signature ratio of including shadow to excluding one
In the next place, we estimated textural features from the same areas analyzed polarization signatures. For PI-SAR data, it is difficult to compare as it stands because the resolutions depend on the observation frequencies (X and L-band). Hence two kinds of sub-images were compared for X-band data. One of them was the features derived from normal pixel spacing images, another one was derived from thinned out images to match the resolution to L-band image data. Furthermore, features of thinned out X-band images are compared with the features of L-band normal pixel spacing images [10].
In this study, GLCM (Gray Level Co-occurrence Matrix) method was used to estimate textural features. In this method, textures are defined from distances and directions of neighbor two pixels. Some textural features derived by this method are proposed, Angular Second Moment (ASM), Contrast (CON), Entropy (ENT), and so on [9],[11],[12]. Each element of GLCM is expressed as P(i, j, d, q ), and it is changed into probability variable p(i, j, d, q ) by equation (1) to derive the textural features.
To analyze the difference by frequency band, the feature property diagram for the same area of L-band normal pixel spacing image data is shown Fig.6.
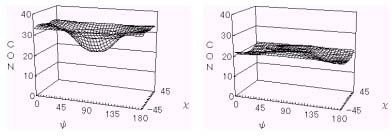 | |
| (a) Normal pixel spacing image data | (b) Thinned out image data |
Fig.5: Polarization properties for X-band residential area image
Fig.6: Polarization property diagram for residential area of L-band normal pixel spacing image
The first, fluctuations of polarization signatures caused by including shadows in partial area are considered. Back-scattering for the shadow is much smaller, so that the elements of Mueller matrix are also smaller wholly. Hence, averaged values of the elements are smaller than the area excluding shadows relatively. Therefore, values of s0 become smaller, too. On the other hand, the shapes of polarization signature diagrams are preserved because back-scattering for shadows depend on the polarization scarcely.
Next, the polarization properties of textural features are considered. For the textural features like contrast that depend on the intensity of the change of gray level in partial area, feature values decreased for thinned images. Especially, in the residential area, though the minimum value was around VV polarization for normal pixel spacing images, the minimum was around HH polarization for thinned images. Hence, we found differences of the pattern caused by resolution appear in the same area images, and these influence polarization properties. Textures were changed by the wave-length, we consider that was caused by the relationship between wave-length with the size and arrangement of targets.
6. Conclusions
In this study, the fluctuations of polarization signatures and textural features for the situation including shadow in the objective areas using high resolution PI-SAR images. For polarization signature, the value of s0 decreased relatively by including shadow, dependence on polarization was preserved. On the other hand, for textural feature, the change appeared in the polarization properties. Therefore, to analyze high resolution SAR images, the rate of shadow in objective area should be considered. For more land-cover pattern, this research is needed to advance.
Acknowledgment
The authors would like to thank Dr. Masaharu FUJITA, Professor of Tokyo Metropolitan Institute of Technology, Makoto SATAKE and Dr. Tatsuharu KOBAYASHI, Senior research official of Communications Research Laboratory, Ministry of Posts and Telecommunications, offered the data of PI-SAR.
References
- H. A. Zebker and J. J. van Zyl: "Imaging Radar Polarimetry: A Review," Proc. IEEE, Vol.79, No.11, pp.1583~1606, 1991.
- F. T. Ulaby and C. Elachi: "Radar Polarimetry for Geoscience Applications," Artech House, Inc., 1990.
- J. J. van Zyl, H. A. Zebker, and C. Elachi: "Imaging radar polarization signatures: Theory and observation," Radio Science, Vol.22, No.4, pp.529~543, 1987.
- T. Hoshi, T. Yamada, and M. Fujita: "Analysis of Textural Feature Using SIR-C Polarimetric Image Data," Trans. IEICE, Vol.J82B, No.2, pp.283~291, 1999.
- T. Yamada and T. Hoshi: "Application of Polarization Signatures and Textural Features to Classification of Polarimetric SAR Images," Proc. NAGANO magel '99, pp.81~84, 1999.
- T. Kobayashi, S. Uratsuka, A. Nadai, T. Umehara, M. Satake, H. Sawada, N. Mitsuzuka, G. Takao, S. Ishibashi and M. Shimada: "Forest observation by high resolution airborne dual-frequency SAR," Proc. Joint Conference of JSPRS and RSSJ, pp.563~564, 1999.
- N. Sudo, M. Furuya, A. Iwashita, H. Shimoda, T.Sakata, T. Matsuoka, S. Uratsuka, M. Satake, T. Kobayashi, T. Umehara, A. Nadai, H. Meno and H. Masuko: "The land cover classification by airborne high-resolution multi-parameter synthetic aperture radar," Proc. Joint Conference of JSPRS and RSSJ, pp.559~562, 1999.
- Y. Yamaguchi: "Fundamentals of Polarimetric Radar and Its Applications," Realize, Inc., 1998.
- T. Yamada and T. Hoshi: "Analysis of the surface polarization properties using high resolution airborne PI-SAR data," Proc. The 27th Conference of RSSJ, pp.163~166, 1999.
- T. Yamada and T. Hoshi: "Investigation of the polarization properties of textural features for the high resolution airborne PI-SAR images," Proc. The 28th Conference of RSSJ, pp.43~44, 2000.
- R. M. Haralick, K. Shanmugam, and Its'hak Dinstein: "Textural Features for Image Classification," IEEE Trans. Systems, Man, and Cybernetics, Vol.SMC3, No.6, pp.610~621, 1973.
- T. Hashimoto and M. Matsuo: "One Method of Texture Analysis of Synthetic Aperture Radar Images," Technical Report of IEICE, Vol.IE86-88, pp.33~40, 1986.