| GISdevelopment.net ---> AARS ---> ACRS 2000 ---> AirSar/Master |
The Use of Airsar Data for
Assessing the Potential of Future Spaceborne Sar for Regional Estimation
of Woodland Biomass in Australia
A.K. Milne1, N. Cronin1, R.M. Lucas1, C. Witte2 and R. Denham2
1School of Geography, the University of New South Wales, Sydney, NSW, 2052.
2Forest Ecosystem Assessment and Planning, Queensland Department of Natural Resources, Resource Sciences Centre, 80 Meiers Road, Indooroopilly, QLD, 4068
Corresponding author A. K. Milne
Office of Postgraduate Studies, The University of New South Wales Sydney, NSW, 2052, Australia
Telephone: 61 2 9385 2731 Facsimile: 61 2 9385 3733
E-MAIL : t.milne@unsw.edu.au
Keywords:
Abstract
With the expected launch of polarimetric spaceborne Synthetic Apaerture Radar (SAR) sensors over the next few years, namely ENVISAT ASAR (C band) and PALSAR (L band), there is an opportunity for regional estimation of forest and woodland biomass in Australia. However, due largely to political pressures, there is an increasing need to provide reliable estimates of Australia's greenhouse gas emissions resulting from changes in vegetation biomass within a relatively short timeframe. For this reason, the use of existing Landsat-based methods for biomass estimation is likely to continue, despite the known limitations of optical sensors for this purpose and the demonstration internationally of the benefits of SAR. This approach is, however, justified given the uncertainty in the potential use of future SAR sensors.
To address this uncertainty, research was undertaken to investigate how current airborne SAR sensors may be used to assess the potential of future SAR sensors for biomass estimation. This was undertaken by comparing relationships established with above ground/component biomass and NASA JPL AIRSAR data with those established with existing spaceborne SAR data at similar wavelengths and polarisations.
The study was conducted in an area near Talwood, southern Queensland. Ground estimates of above ground and component biomass were generated by applying a range of allometric equations to tree size measurements collected, in 1998 and 1999, from 44 fixed and variable area plots. Relationships were then established between total/component biomass and Japanese Earth Resources Satellite (JERS1) SAR L band HH, Space Shuttle Imaging Radar (SIR-C) SAR C band VV and L band VV, and NASA JPL AIRSAR C band VV, L band VV and fully polarimetric P band data, all acquired over the period 1994 to 1996.
The study indicated of C, L and P band data at all polarisations occurred at an above ground biomass of approximately 20-30 Mg ha-1, 60 Mg ha-1 and 80-100 Mg ha-1 respectively. Different SAR wavelengths were also shown to interact with different components of the biomass. Furthermore, the saturation levels and relationships observed were relatively consistent between sensors. The study concluded that the AIRSAR can be used to determine the likely potential of future spaceborne SAR sensors for biomass estimation. Furthermore, the added benefits of using SAR for biomass estimation, and hence for better quantifying greenhouse gas emissions from land use change and forestry, were demonstrated.
1. Introduction
Although a number of studies have demonstrated relationships between SAR data and vegetation biomass, the majority have focused on forests in tropical regions and the northern hemisphere. The research presented in this paper addresses the potential of SAR for quantifying the total above ground biomass (TAGB) of Australia's Eucalyptus woodlands.
2. Specific Objectives
The study aimed to determine whether
a) statistically significant relationships exist between polarimetric C, L and P band data and component (leaf, branch and trunk) biomass, and
b) relationships are consistent regardless of whether TOPSAR and SIR-C SAR C- and L-band data are used.
The research formed part of a pilot study aimed at determining whether a more rigorous investigation into the use of SAR for biomass estimation was warranted. For the study, only historical SAR data sets were available.
3. Study Area
The study was conducted in Queensland where, for the period 1990 to 1995, 56 % (1 million ha) of the total area of native woody vegetation clearance in Australia has occurred, averaging 268,060 ha yr-1. The study region, near Talwood (28º29'S, 149º28'E) supported extensive areas of open woodland consisting largely of Poplar Box (Eucalyptus populnea), Silver-leaved Ironbark (E. melanaphloia), Belah (Casuarina cristata), Brigalow (Acacia harpophylla) and White Cypress Pine (Callitris glaucophylla). Common understorey species included Wilga (Geijera parviflora) and Sandalwood Box (Eremophila mitchelli). Due to the complex nature of land use and management practices, the landscape consisted of a mosaic of cleared fields and woodland communities in various stages of degradation and/or regeneration.
4. Methods
Space Shuttle Imaging Radar (SIR-C SAR; C-and L-band VV polarisations), and NASA JPL TOPSAR (C-band HH, L-band VV and fully polarimetric P-band) were available for the study area for the years 1994 and 1996 respectively. Pre-processing included georeferencing of all SAR data to Australian Map Grid (AMG) coordinates, resampling to a pixel resolution of 12.5 m, and converting data to the backscatter coefficient (so ), defined as the average radar cross section per unit area of the individual scattering elements. For display purposes, so was expressed in decibels (dB).
5. Field Data Collection
In October, 1998, field data were collected from 29 plots sited in woodlands in varying states of degradation and/or regeneration. In June, 1999, a further 14 plots were established largely in areas of younger regeneration. Although the field and remotely sensed data were collected several years apart, the rates of growth within these woodlands are relatively low and changes in biomass over the intervening periods were not considered to be substantial. Woodlands cleared or degraded since 1994 were not sampled.
Sampling was undertaken using fixed area plots in the early regeneration woodlands and variable area plots, sampled using the prism wedge method [1], in older regenerating and intact, albeit degrading, woodlands. The AMG co-ordinates of the centre of plots were obtained using a Global Positioning System with an accuracy of ± 10 metres. All trees > 3 cm diameter (D, at c 30 cm) were measured for D (at both 30 cm and 130 cm). Trees with D < 3 cm (at c 30 cm) were counted and their height (H, cm) was estimated. All trees measured were identified to genus or species. For selected genera/species, relationships were established between D and H. For all trees in each plot, the TAGB and component biomass was estimated using allometric equations [2,3], which required D and/or H as input, for Eucalpytus and understorey species. In all calculations, a bias correction factor was applied to avoid systematic bias when antilogging estimates to arithmetic units [4]. As allometric equations for biomass estimation were unavailable for Casuarina cristata and Callitris glaucophylla, the few plots containing these species were excluded from the analysis. For all plots, the component biomass was scaled-up to generate an estimate of component biomass per hectare (Mg ha-1). For regions centred on each plot location, SIR-C SAR and TOPSAR data were extracted, averaged and related to component biomass.
6. Results
Relationships between biomass components
Pearson's product moment correlation coefficients (r) indicated significant relationships (at the 0.01 level) between TAGB and all biomass components (branch, trunk and leaf), and between branch and trunk biomass. The leaf biomass was related to branch biomass at the 0.05 level, although the relationship with trunk biomass was insignificant.
Relationships between biomass and SAR data
Relationships between both SIR-C SAR and TOPSAR data and component biomass (including TAGB) were investigated initially on the basis of the correlation coefficient between the log of both the backscatter coefficient (so, dB) and estimated biomass. When establishing relationships, data for low biomass pastures were included.
Correlation coefficients between SIR-C SAR C- and L-band data with leaf, branch, trunk and TAGB were significant at the 0.01 level, with the strongest relationship observed between L-band VV data and TAGB (Table 1). L-band VV backscatter was related more closely to the woody (i.e., branches and trunks) rather than the leaf biomass. The relationships between C-band VV data and all components of the biomass were comparatively weak, with the exception of the relationship with leaf biomass.
The correlation coefficients between TOPSAR C-, L- and P- band (all polarisations) and all biomass components were also significant at the 0.01 level (Table 2). P band backscatter (all polarisations) was more strongly related to TAGB, and also branch and trunk biomass, compared to L band VV and C band HH backscatter. The weakest relationship with woody (trunk and branch) biomass was observed with C band HH backscatter. The strength of the relationship with leaf biomass was similar for all wavebands.
All figures significant at the 0.01 level (two tailed).
Table 1: Pearson's correlation coefficients (r) between the logarithm of component biomass and SIR-C SAR C- and L-band backscatter.
All figures significant at the 0.01 level (two tailed).
Table 2: Pearson's correlation coefficients (r) between the logarithm of component biomass and TOPSAR C-, L- and P-band backscatter.
The lowest dynamic range was observed for TOPSAR C band HH (-9.3 to -21.6; range -12.3 dB) and L band VV (-44.8 to -28.2; range -16.6) data and the largest for P band HV data (-18.9 to - 45.9 dB; range 27.0). Saturation of both SIR-C SAR and TOPSAR C- and L-band data occurred at approximately 20-30 Mg ha-1 and 50-60 Mg ha-1 respectively. P-band saturation (all polarisations) occurred at 80-100 Mg ha-1.
7. Discussion
The results indicated the greater interaction of L- and P-band microwaves with the woody components of the biomass compared to C-band microwaves. The relationship between C-band and woody biomass is more likely to have resulted from the inherent relationships of leaf with branch, trunk and TAGB. Microwaves at both L and P band were related almost equally with both the trunk and the branch biomass. The correspondence in these relationships was attributed partly to the similarity in the size range and orientation of branches and trunks. However, the inherent relationship between branch and trunk biomass leads to uncertainties as to the interaction of these wavelengths with different vegetation components.
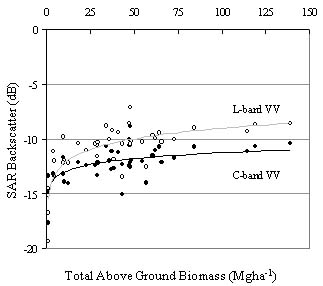
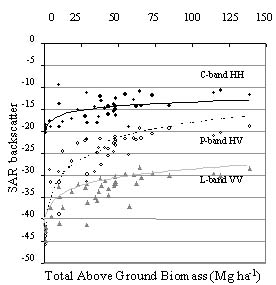
Figure. 1: Relationship between TAGB and a) SIR-C SAR C- and L band backscatter and b) TOPSAR C-, L- and P-band backscatter
The TAGB saturation levels for both TOPSAR C-band HH and SIR-C SAR C-band VV and TOPSAR L-band VV and SIR-C SAR L-band VV were similar at 20-30 Mg ha-1 and 50-60 Mg ha-1 respectively. Studies in Injune suggest a saturation of c 60-80 Mg ha-1 in the relationship with JERS-1 SAR L-band HH data. In spatially quantifying the TAGB of woodland vegetation, P-band HH data seems optimal due to the observed strength in the relationship with TAGB, the higher limit of biomass saturation (100 Mg ha-1), and the greater dynamic range of the data.
8. Conclusions And Future Work
Polarimetric C, L and P band data can be related to TAGB and different biomass components with varying degrees of significance. The better relationships were established using TOPSAR data. The main similarities in using TOPSAR and SIR-C SAR were the strength of the relationships between C- and L-band data and component mass, and the TAGB saturation levels for both C-band and L-band data. The study suggests that single-band SAR may be used to quantify the TAGB of woodlands in Australia, although better results are likely to be obtained using polarimetric SAR. This capacity will be fully tested using PACRIM AIRSAR data collected in August, 2000.
9. Acknowledgments
The authors thank the Bureau of Resource Sciences and the Australian Greenhouse Office, the Australian Research Council and the Queensland Department of Natural Resources for financial and logistical support.
10. References
Abstract
With the expected launch of polarimetric spaceborne Synthetic Apaerture Radar (SAR) sensors over the next few years, namely ENVISAT ASAR (C band) and PALSAR (L band), there is an opportunity for regional estimation of forest and woodland biomass in Australia. However, due largely to political pressures, there is an increasing need to provide reliable estimates of Australia's greenhouse gas emissions resulting from changes in vegetation biomass within a relatively short timeframe. For this reason, the use of existing Landsat-based methods for biomass estimation is likely to continue, despite the known limitations of optical sensors for this purpose and the demonstration internationally of the benefits of SAR. This approach is, however, justified given the uncertainty in the potential use of future SAR sensors.
To address this uncertainty, research was undertaken to investigate how current airborne SAR sensors may be used to assess the potential of future SAR sensors for biomass estimation. This was undertaken by comparing relationships established with above ground/component biomass and NASA JPL AIRSAR data with those established with existing spaceborne SAR data at similar wavelengths and polarisations.
The study was conducted in an area near Talwood, southern Queensland. Ground estimates of above ground and component biomass were generated by applying a range of allometric equations to tree size measurements collected, in 1998 and 1999, from 44 fixed and variable area plots. Relationships were then established between total/component biomass and Japanese Earth Resources Satellite (JERS1) SAR L band HH, Space Shuttle Imaging Radar (SIR-C) SAR C band VV and L band VV, and NASA JPL AIRSAR C band VV, L band VV and fully polarimetric P band data, all acquired over the period 1994 to 1996.
The study indicated of C, L and P band data at all polarisations occurred at an above ground biomass of approximately 20-30 Mg ha-1, 60 Mg ha-1 and 80-100 Mg ha-1 respectively. Different SAR wavelengths were also shown to interact with different components of the biomass. Furthermore, the saturation levels and relationships observed were relatively consistent between sensors. The study concluded that the AIRSAR can be used to determine the likely potential of future spaceborne SAR sensors for biomass estimation. Furthermore, the added benefits of using SAR for biomass estimation, and hence for better quantifying greenhouse gas emissions from land use change and forestry, were demonstrated.
1. Introduction
Although a number of studies have demonstrated relationships between SAR data and vegetation biomass, the majority have focused on forests in tropical regions and the northern hemisphere. The research presented in this paper addresses the potential of SAR for quantifying the total above ground biomass (TAGB) of Australia's Eucalyptus woodlands.
2. Specific Objectives
The study aimed to determine whether
a) statistically significant relationships exist between polarimetric C, L and P band data and component (leaf, branch and trunk) biomass, and
b) relationships are consistent regardless of whether TOPSAR and SIR-C SAR C- and L-band data are used.
The research formed part of a pilot study aimed at determining whether a more rigorous investigation into the use of SAR for biomass estimation was warranted. For the study, only historical SAR data sets were available.
3. Study Area
The study was conducted in Queensland where, for the period 1990 to 1995, 56 % (1 million ha) of the total area of native woody vegetation clearance in Australia has occurred, averaging 268,060 ha yr-1. The study region, near Talwood (28º29'S, 149º28'E) supported extensive areas of open woodland consisting largely of Poplar Box (Eucalyptus populnea), Silver-leaved Ironbark (E. melanaphloia), Belah (Casuarina cristata), Brigalow (Acacia harpophylla) and White Cypress Pine (Callitris glaucophylla). Common understorey species included Wilga (Geijera parviflora) and Sandalwood Box (Eremophila mitchelli). Due to the complex nature of land use and management practices, the landscape consisted of a mosaic of cleared fields and woodland communities in various stages of degradation and/or regeneration.
4. Methods
Space Shuttle Imaging Radar (SIR-C SAR; C-and L-band VV polarisations), and NASA JPL TOPSAR (C-band HH, L-band VV and fully polarimetric P-band) were available for the study area for the years 1994 and 1996 respectively. Pre-processing included georeferencing of all SAR data to Australian Map Grid (AMG) coordinates, resampling to a pixel resolution of 12.5 m, and converting data to the backscatter coefficient (so ), defined as the average radar cross section per unit area of the individual scattering elements. For display purposes, so was expressed in decibels (dB).
5. Field Data Collection
In October, 1998, field data were collected from 29 plots sited in woodlands in varying states of degradation and/or regeneration. In June, 1999, a further 14 plots were established largely in areas of younger regeneration. Although the field and remotely sensed data were collected several years apart, the rates of growth within these woodlands are relatively low and changes in biomass over the intervening periods were not considered to be substantial. Woodlands cleared or degraded since 1994 were not sampled.
Sampling was undertaken using fixed area plots in the early regeneration woodlands and variable area plots, sampled using the prism wedge method [1], in older regenerating and intact, albeit degrading, woodlands. The AMG co-ordinates of the centre of plots were obtained using a Global Positioning System with an accuracy of ± 10 metres. All trees > 3 cm diameter (D, at c 30 cm) were measured for D (at both 30 cm and 130 cm). Trees with D < 3 cm (at c 30 cm) were counted and their height (H, cm) was estimated. All trees measured were identified to genus or species. For selected genera/species, relationships were established between D and H. For all trees in each plot, the TAGB and component biomass was estimated using allometric equations [2,3], which required D and/or H as input, for Eucalpytus and understorey species. In all calculations, a bias correction factor was applied to avoid systematic bias when antilogging estimates to arithmetic units [4]. As allometric equations for biomass estimation were unavailable for Casuarina cristata and Callitris glaucophylla, the few plots containing these species were excluded from the analysis. For all plots, the component biomass was scaled-up to generate an estimate of component biomass per hectare (Mg ha-1). For regions centred on each plot location, SIR-C SAR and TOPSAR data were extracted, averaged and related to component biomass.
6. Results
Relationships between biomass components
Pearson's product moment correlation coefficients (r) indicated significant relationships (at the 0.01 level) between TAGB and all biomass components (branch, trunk and leaf), and between branch and trunk biomass. The leaf biomass was related to branch biomass at the 0.05 level, although the relationship with trunk biomass was insignificant.
Relationships between biomass and SAR data
Relationships between both SIR-C SAR and TOPSAR data and component biomass (including TAGB) were investigated initially on the basis of the correlation coefficient between the log of both the backscatter coefficient (so, dB) and estimated biomass. When establishing relationships, data for low biomass pastures were included.
Correlation coefficients between SIR-C SAR C- and L-band data with leaf, branch, trunk and TAGB were significant at the 0.01 level, with the strongest relationship observed between L-band VV data and TAGB (Table 1). L-band VV backscatter was related more closely to the woody (i.e., branches and trunks) rather than the leaf biomass. The relationships between C-band VV data and all components of the biomass were comparatively weak, with the exception of the relationship with leaf biomass.
The correlation coefficients between TOPSAR C-, L- and P- band (all polarisations) and all biomass components were also significant at the 0.01 level (Table 2). P band backscatter (all polarisations) was more strongly related to TAGB, and also branch and trunk biomass, compared to L band VV and C band HH backscatter. The weakest relationship with woody (trunk and branch) biomass was observed with C band HH backscatter. The strength of the relationship with leaf biomass was similar for all wavebands.
| Log | SIR-C Backscatter (dB) | |
| C VV |
L VV | |
| 1.1 TAGB | 0.66 | 0.81 |
| Branch | 0.61 | 0.74 |
| Trunk | 0.59 | 0.70 |
| Leaf | 0.54 | 0.51 |
All figures significant at the 0.01 level (two tailed).
Table 1: Pearson's correlation coefficients (r) between the logarithm of component biomass and SIR-C SAR C- and L-band backscatter.
| Log | TOPSAR Backscatter (dB) | |||||
| C HH |
L VV |
P HH |
P VV |
P HV |
P TP | |
| 1.2 TAGB | 0.61 | 0.85 | 0.91 | 0.85 | 0.91 | 0.90 |
| Branch | 0.58 | 0.79 | 0.86 | 0.81 | 0.86 | 0.85 |
| Trunk | 0.51 | 0.77 | 0.84 | 0.79 | 0.82 | 0.83 |
| Leaf | 0.48 | 0.54 | 0.48 | 0.45 | 0.45 | 0.48 |
All figures significant at the 0.01 level (two tailed).
Table 2: Pearson's correlation coefficients (r) between the logarithm of component biomass and TOPSAR C-, L- and P-band backscatter.
The lowest dynamic range was observed for TOPSAR C band HH (-9.3 to -21.6; range -12.3 dB) and L band VV (-44.8 to -28.2; range -16.6) data and the largest for P band HV data (-18.9 to - 45.9 dB; range 27.0). Saturation of both SIR-C SAR and TOPSAR C- and L-band data occurred at approximately 20-30 Mg ha-1 and 50-60 Mg ha-1 respectively. P-band saturation (all polarisations) occurred at 80-100 Mg ha-1.
7. Discussion
The results indicated the greater interaction of L- and P-band microwaves with the woody components of the biomass compared to C-band microwaves. The relationship between C-band and woody biomass is more likely to have resulted from the inherent relationships of leaf with branch, trunk and TAGB. Microwaves at both L and P band were related almost equally with both the trunk and the branch biomass. The correspondence in these relationships was attributed partly to the similarity in the size range and orientation of branches and trunks. However, the inherent relationship between branch and trunk biomass leads to uncertainties as to the interaction of these wavelengths with different vegetation components.
Figure. 1: Relationship between TAGB and a) SIR-C SAR C- and L band backscatter and b) TOPSAR C-, L- and P-band backscatter
The TAGB saturation levels for both TOPSAR C-band HH and SIR-C SAR C-band VV and TOPSAR L-band VV and SIR-C SAR L-band VV were similar at 20-30 Mg ha-1 and 50-60 Mg ha-1 respectively. Studies in Injune suggest a saturation of c 60-80 Mg ha-1 in the relationship with JERS-1 SAR L-band HH data. In spatially quantifying the TAGB of woodland vegetation, P-band HH data seems optimal due to the observed strength in the relationship with TAGB, the higher limit of biomass saturation (100 Mg ha-1), and the greater dynamic range of the data.
8. Conclusions And Future Work
Polarimetric C, L and P band data can be related to TAGB and different biomass components with varying degrees of significance. The better relationships were established using TOPSAR data. The main similarities in using TOPSAR and SIR-C SAR were the strength of the relationships between C- and L-band data and component mass, and the TAGB saturation levels for both C-band and L-band data. The study suggests that single-band SAR may be used to quantify the TAGB of woodlands in Australia, although better results are likely to be obtained using polarimetric SAR. This capacity will be fully tested using PACRIM AIRSAR data collected in August, 2000.
9. Acknowledgments
The authors thank the Bureau of Resource Sciences and the Australian Greenhouse Office, the Australian Research Council and the Queensland Department of Natural Resources for financial and logistical support.
10. References
- Beers T., and Miller, C., "Point Sampling: Research Results, Theory and Applications", Purdue University, Agricultural Experiment Station Lafayette, Research Bulletin, vol. 786, August 1965.
- Burrows, W.H., Compton, J.F., Hoffman, M.B., Back, P.V., and Tait, L.J., "Allometric relationships and community biomass estimates for some dominant eucalypts and associated species in Central Queensland woodlands", unpublished.
- Harrington, G., "Estimation of above ground biomass of trees and shrubs in Eucalyptus populnea F. Muell. woodland by regression of mass on trunk diameter and plant height", Australian Journal of Botany, vol. 2, pp. 135-143, 1979.
- Beauchamp, J.J., and Olsen, J.S., "Corrections for bias in regression estimates after logarithmic transformation", Ecology, vol. 54, pp. 1403-1407, 1973.
- Beaudoin, A., Le Toan, T., Goze, S., Nezry, E., Lopes, A., Mougin, E., Hsu, C.C., Han, H.C., Kong, J.A., and Shin, R.T., "Retrieval of forest biomass from SAR data", International Journal of Remote Sensing, vol. 15, pp. 2777-2796, 1994.