| GISdevelopment.net ---> AARS ---> ACRS 2000 ---> Agriculture |
Analysis Of Spectral
Characteristics Of Rice Canopy Under Water Deficiency
Chwen-Ming Yang, Muh-Rong
Su
Agronomist and Assistant, Department of Agronomy
Taiwan Agricultural Research Institute
189 Chung-Cheng Road, Wufeng, Taichung Hsien, Taiwan 41301
Tel: (886)-4-330-2301ext.135 Fax: (886)-4-330-2806
E-mail: cmyang@wufeng.tari.gov.tw
Agronomist and Assistant, Department of Agronomy
Taiwan Agricultural Research Institute
189 Chung-Cheng Road, Wufeng, Taichung Hsien, Taiwan 41301
Tel: (886)-4-330-2301ext.135 Fax: (886)-4-330-2806
E-mail: cmyang@wufeng.tari.gov.tw
Key Words: Spectral characteristics, Rice, Water deficiency, Vegetation index, Red edge
Abstract
Information of spectral characteristics of rice canopy was extracted from ground-based remotely sensed reflectance spectra of hyperspectral resolution during water stress period in the vegetative growth phase. The analyses were focused mainly on the correlation between levels of water deficiency and spectral characteristics or parameters across wavebands of 350-2400 nm. It was shown that reflectance spectrum of rice canopy was sensitive to water stress, while different wavebands had diverse responses to of water deficiency. A dramatic difference of correlation coefficients (r) along the spectral range was found between stress treatments. The correlation between reflectance and stress level can be best represented at wavelength 2113.5 nm, where the reflectance and the reflectance ratio to control were the most significant difference. Among 12 characteristics wavelengths selected to examine their correlation to water deficits, the reflectance of 8 wavelengths had significant linear relationships with stress levels. Results further indicate that changes in red-edge position and slope did not correlate to soil water potential. The relationship between NDVI and soil water potential was significant, the increasing of soil water stress with decreasing value of NDVI.
1. Introduction
The use of canopy spectral data from remote sensing for agricultural purposes such as crop growth monitoring, yield prediction, and stress evaluation has been widely adopted nowadays. Crop growth models describing the relationship between physiological status of plants and effects of environmental factors were established and modified for various applications. Before any practical utilization in agricultural fields, however, spectral characteristics or parameters should be identified and then be incorporated into algorithms linked to the relationship in this respect. On the other hand, remote sensing may yield information to the actual conditions of a crop and in turn improving the accuracy and structure of crop growth models. Currently reflectance from visible and near-infrared regions has been used as variables for estimating physical traits of a crop in modeling. Much more research has also been aimed at combing the reflectance in different wavebands in assessment of growth parameters for minimizing undesirable interference from soil background and atmosphere. Such combinations are the so-called egetation indices (Clevers, 1988, 1989; Huete, 1988; Kauth and Thomas, 1976; ichardson and Wiegand, 1977). In any case, variables employed for these applications should be able to closely represent growth characteristics or behavior.
On developing of satellite remote sensing in the 1970s, it was broad bands rather than narrow band width were used for spectral detecting due to the limitations of hardware and software techniques. With the advancement of remote sensing technology, when the spectral resolution reached to the order of 10 nm or smaller, it becomes possible to uncover minor differences in spectra data in details (Curran, 1989). Specific features of reflectance spectrum may be extracted in comparable to the specific changes of physical traits or internal chemical compounds for a crop (Elvidge, 1990; Goetz, 1991). Responses of crops to environmental stresses such as nutrient deficiency, drought, frost, and pests may also be distinguished and classified qualitatively as well as quantitatively.
The objectives of this research are to analyze remote sensing data of rice canopy from ground measurements during water stress period in the vegetative growth phase. Information of spectral characteristics was extracted from reflectance spectra of high spectral resolution. The correlation between levels of water deficit and changes in spectral parameters is studied and the potential of applying such relationship for estimating strength and status of water deficiency is evaluated.
2. Materials And Methods
The potential of using spectral characteristics for water deficiency evaluation was examined from the ground-based remotely sensed hyperspectral data over rice canopy under varied levels of soil water deficits. Rice (Oryza sativa L. cv. Tainung 67) plants were grown on a loam soil at a density of 22 plants m -2 , with row spacing of 0.3 m and plant distance of 0.15 m, in opaque plastic containers (1.0 m W × 1.2 m L × 0.55 m H). The 20-d old seedlings were transplanted with 1 plant per hill on 5 April 2000, and the containers were placed in the experimental farm of Taiwan Agricultural Research Institute at Wufeng, Taiwan. Plants were fertilized and well taken care of to avoid the infestations of weeds and pests. When reached to leaf 8 to leaf 9 stage in the vegetative growth phase, containers were divided into three groups and subjected to water-withholding treatments. At this stage, vegetative cover was considered dense with the covering percentage more than 70%.
The collected ground truth was made periodically from 6 days after stress treatments with a portable spectroradiometer (model GER-2600, Geophysical and Environmental Research Corp., New York, USA) on near cloudless days at about solar noon. There were 10 levels of soil water deficits attained from 3 groups of containers during the experimental period, with one control (the well-watered plants) for each group (Table 1). The scanner of spectroradiometer has a 10 degree field-of-view (FOV) and was held at a nadir viewing over rice canopy, at a distance of 1 m, to acquire the reflected radiance within 330-2500 nm. Reflectance spectrum was obtained by comparing the radiance of the target canopy with the radiance of a standard (the so-called Spectrolon). Six measurements of radiance spectra were made from canopy of every treatments and each measurement was set as a mean of 3 individual full-range spectral scans. A mean reflectance spectrum was calculated from those of 6 measurements. As the reflectance above wavelengths of 2400 nm had higher noise and seemed not to affect the objectives of this study, data obtained above 2400 nm were excluded from analysis. Care was taken to prevent the influence of shadow and background.
There were 4 approaches employed to determine spectral characteristics or parameters for evaluation of water deficiency in rice plants. The first approach was to acquire wavelengths of maximum correlation coefficient (r), from the analyzed wavelength domain (350-2400 nm), by computing curve of correlation coefficients for the reflectance from different treatments. The second approach was to compare difference in reflectance relative to the controls. The percent difference in reflectance over the wavelength domain between the stressed plants and the well-watered plants were calculated, and then subjected to a correlation processing as aforementioned to compare the effect of different smoothing intensity on the correlation between the wavelengths. In the third approach, 12 wavelengths were selected from the apparent peaks and valleys appeared in the mean reflectance spectrum of each controls, and characteristics wavelengths were determined from mean value of each of 12 wavelength intervals. The reflectance of 12 characteristics wavelengths from treatments were used to examine for their correlation to levels of water deficits. The final approach was to direct correlate the red edge and the normalized difference vegetation index (NDVI) to soil water potentials. The region of red-edge is defined as wavelengths between red minimum (RED) and near-infrared maximum (NIR). The position of the red-edge is determined by the wavelength of the main inflexion point of the red-edge slope, which is the maximum value of the first order derivatives in the red-edge region. Both the position and the slope of the red-edge changed between levels of stress were tested. The NDVI was calculated by the equation: (NIR-RED)/(NIR+RED).
3. Results And Discussion
The spectral reflectance in the domain of 350 to 2400 nm from rice canopy under varied water deficits and their correlation to stress levels were graphed in Figure 1. It was shown that reflectance spectrum was sensitive to water stress, while different wavebands had diverse responses to water deficiency. A dramatic difference of correlation coefficient (r) along the spectral range was found between stress treatments. The curve gives an overall picture of the correlation feature for reflectance spectra in response to water stress. By examining the differences between wave regions, the maximum values of r and the corresponding wavelengths in different regions of reflectance spectra were identified (Table 1). The percent differences in reflectance between the stressed plants and the controls were further compared in Figure 2. It shows that the intensity of the correlation curve is similar, but in less extent, to the aforementioned feature of the processing results. The most pronounced spectral characteristics in relation to water deficits was the reflectance at wavelength 2113.5 nm (r=-0.97).
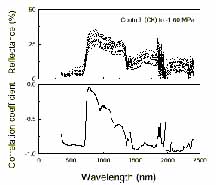
Fig. 1. The spectral reflectance in the domain of 350-2400 nm from rice canopy under varied levels of water deficit and their correlation coefficients to water stress.
spectra and ratio spectra @ from rice canopies under various levels of soil water deficits.
| Item | Region | Waveband | Wavelength | R |
| Reflectance Spectrum | Ultraviolet to visible | 350-740 nm | 697.3 nm | -0.90** |
| Near infrared | 740-1300 nm | 1176.9 nm | -0.63* | |
| Middle infrared | 1300-1800 nm | 1508.3 nm | -0.95** | |
| Shortwave infrared | 1800-2400 nm | 2113.5 nm | -0.98** | |
| Ratio Spectrum | Ultraviolet to visible | 350-740 nm | 692.8 nm | -0.87** |
| Near infrared | 740-1300 nm | 1176.9 nm | -0.51 | |
| Middle infrared | 1300-1800 nm | 1508.3 nm | -0.90** | |
| Shortwave infrared | 1800-2400 nm | 2113.5 nm | -0.97** |
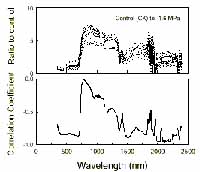
Fig. 2. The reflectance difference to the controls in the domain of 350-2400 nm from rice canopy under varied levels of water deficit and their correlation coefficients to water stress.
From the apparent peaks and valleys of reflectance spectra measured in the well-watered plants during the experimental period, 12 characteristics wavelengths were identified (Table 2). Among these characteristics wavelengths selected to examine their correlation to water deficits, the reflectance of 8 wavelengths had significant linear relationships with stress levels; the coefficients all greater than 0.61. The reflectance at 2245 nm had the highest r value (0.80), but not as good as at 2113.5 nm. Based on such results, it suggests that soil water stress did not change dramatically the overall pattern of reflectance spectrum of rice canopy.
Table 2. The correlation coefficients for the 13 characteristics wavelengths selected from reflectance spectra of rice
canopy in response to soil water deficits @ .
| Correlation coeffcient |
Characteristics wavelength (nm) | |||||||||||
| 486 | 553 | 660 | 881 | 1192 | 1270 | 1376 | 1406 | 1435 | 1676 | 1810 | 2245 | |
| r | 0.78** | 0.76** | 0.78** | 0.03 | 0.36 | 0.35 | 0.61* | 0.50 | 0.68** | 0.76** | 0.78** | 0.80** |
@ The 13 levels of soil water deficits were -0.36, -0..51, -0.64, -0.73, -0.86, -1.45, -1.50, -1.53 and -1.60 MPa plus CK1, CK2 and CK3. (r=0.50).
It has been reported that the absorption maximum of chlorophyll in the visible band and the near-infrared shoulder of the red-edge will be changed upon environmental stress (Horler et al., 1983). It is therefore a reasonable prediction that both position and slope of the red-edge may be altered by the impact of water stress. With hyperspectra at intervals less than 10 nm in this study, position and slope of the red-edge acquired were quite reliable and accurate (Figure 3). However, results show that changes in red-edge position and slope did not correlate to soil water potential. Thus, the red-edge is not a good spectral parameter to distinguish levels of water deficit. On the other hand, the relationship between NDVI and soil water potential was significant (figure 3), the increasing of soil water stress with decreasing value of NDVI.
4. References
· Clevers, J. G. P. W. 1988. The derivation of a simplified reflectance models for the estimation of leaf area index. Remote Sens. Environ. 25, pp.53-69.
· Clevers, J. G. P. W. 1989. The application of a weighted infrared-red vegetation index for estimating leaf area index by correcting for soil moisture. Remote Sens. Environ. 29, pp.25-37.
· Curran, P. J. 1989. Remote sensing of foliar chemistry. Remote Sens. Environ. 30, pp.271-278.
· Elvidge, C. D. 1990 Visible and near infrared reflectance characteristics of dry plant materials. Int. J. Remote Sens. 11, pp.1775-1795.
· Goetz, A. F. H. 1991. Imaging spectrometry for studying earth, air, fire and water. EARSeL Advances in Remote Sensing 1, pp.3-15.
· Horler, D. N. H., M. Dockray and J. Barber. 1983. The red edge of plant leaf reflectance. Int. J. Remoter Sens. 4, pp.273-288.
· Huete, A. R. 1988. A soil adjusted vegetation index (SAVI). Remote Sens. Environ. 25, pp.295-309.
· Kauth, R. J. and G. S. Thomas. 1976. The tasseled cap-a graphic description of the spectral-temporal development of agricultural crops as seen by Landsat. Proc. Symp. On March. Proc. Rem. Sens. Data, Purdue Univ., W. Lafayette, Ind., 4B. pp.41-51
· Richardson, A. J., and C. L. Wiegand. 1977. Distinguishing vegetation from soil background information. Photogram. Eng. Remote Sens. 43, pp.1541-1552.
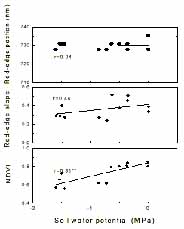
Fig. 3. Changes of position and slope of the red-edge and the nor malized difference vegetation index (NDVI) in response to soil water potential.