| GISdevelopment.net ---> AARS ---> ACRS 2000 ---> Agriculture |
Land degradation due to
hydro-salinity in semi-arid regions Using gis and remote sensing
Nasir Mahmood KHAN* and
Yohei SATO**
Graduate Student* and Professor**
Department of Biology and Environmental Engineering
Graduate School of Agricultural and Life Sciences,
The University of Tokyo 1-1-1 Yayoi,
Bunkyo-ku, Tokyo 133-8657, Japan
Tel: +81-3-5841-5344, Fax: +81-3-5841-8169
Email: mailto:aa97093@mail.ecc.u-tokyo.ac.jpt
Graduate Student* and Professor**
Department of Biology and Environmental Engineering
Graduate School of Agricultural and Life Sciences,
The University of Tokyo 1-1-1 Yayoi,
Bunkyo-ku, Tokyo 133-8657, Japan
Tel: +81-3-5841-5344, Fax: +81-3-5841-8169
Email: mailto:aa97093@mail.ecc.u-tokyo.ac.jpt
KEY WORDS: Remote Sensing, GIS, Hydro-Salinity, NDVI, Interpolation, FDP
Abstract
Fourth drainage project located in the center of Punjab province of Pakistan was selected as a research field. A newly introduced tile drainage system and remodeled surface drains have gradually reduced the waterlogging problem, however, salinity still remains in patches in the area. The present study describes an attempt to monitor land and water management scenarios that caused deterioration of vast productive land, using satellite data.
IRS-IB LISS-II digital data acquired were digitally analyzed along with other field data sets and topographical maps. False Color Composite and unsupervised classified image shows that most of the waterlogging and salinity problems are located along the drainage canals. The buffering analysis along the drainage and irrigation canals was performed to see the hydro-salinity impact on productivity in terms of its vegetation vigor. The Normalized Difference Vegetation Index (NDVI) tends to be lower along drainage and higher along the irrigation canals. It is probably because of the inequity water distribution and locational disadvantage of the down-stream farmers as well. A contrast example of an enterprise model-farm near the project area was observed which does not show any locational unbalance/inequity but exhibits comparable high NDVI values almost all over the farm area, except fallow lands. The extent of waterlogged soils was also estimated through GIS analysis from more than 150 peizometers locations lying within the study area. It was found that 24.5%, 22.0% and 63.4% of the mapped area was under risk of waterlogging (_ 200cm) during 1990, 1993, and 1996 respectively. Evidence is presented that the existing drainage system along with use of groundwater for irrigation reduces the extent of waterlogged soils. However, the reuse of poor quality water to supplement irrigation supplies by the downstream farmers and the failure of a few drainage sumps are likely to disturb the water balance resulting into increased risk of waterlogging and salinity in the area.
Introduction
Environmental land degradation has recently become a global, urgent issue and is now being considered with high priority, specially in the developing counties, to meet food and fiber demands of accelerated population pressure with the limited available resources. Secure balance in the global supply and demand for food has forced humans to develop agriculture in semi-arid to arid lands, which are generally less suitable for agriculture and sensitive to environmental changes. Irrigation systems have always been considered as an effective way of increasing agricultural production since ancient times to bridge the gape of water shortage. Owing to irrigation systems, the farmers have obtained quite stable productivity but they started facing an acute problem of waterlogging and salinity due to seepage from the huge system in most of the developing countries like Pakistan. The farmers, many local and international organizations are struggling now against the so-called "white death" of their lands. Land degradation due to waterlogging and subsequent salinization has been so enlarged that it is now being regarded as a global environmental problem, desertification. It is, therefore, important to monitor land and water management scenarios causing severe land degradation and low productivity. Remote sensing is one of the key tools in monitoring local, regional and global environmental issues. More recently, much attention has been paid to spatial analysis due to merging of geographic information system (GIS) and satellite images for environmental research and applications. The conventional means are however, not only difficult and time consuming but also laborious due to vagaries of the weather. It is prudent to use such emerging technique with an emphasis to its application in semi-arid areas. The present paper describes an attempt, where in IRS-1B, LISS-II (Indian Remote Sensing Satellite) digital data have been used along with other maps and field data, to monitor land degradation due to hydro-salinity and low agricultural productivity (vegetation condition).
Research Field
A reclamation project called as "FDP" (Fourth Drainage Project) was launched to mitigate the twine menace of waterlogging and salinity, in 1983. The FDP area is located in the center of Punjab province of Pakistan and consists of Schedule-I and Schedule-II units. The Schedule-I area covering about 70,000ha was selected as a research filed, lies between 31° 02' to 31° 45' N and 72° 50' to 73° 22' E (Figure 1). It was estimated that 77% and 43% of the total area was under high watertable conditions and salinity respectively, before the installations of a new tile drainage system (Table 1). Mean annual rainfall of the locality is <350mm out of which nearly 75% occurs during monsoon season (July- September). The mean monthly maximum temperature is between 19.4 - 41.2 C°. The mean annual evaporation is as high as 2100mm. Physio-graphically, the area is nearly level to very gentle slope (average topo-gradient is 0.02%) with mean sea level of 190m. Geologically, the soils are alluvial deposits classified as silt loam, loam, and silt clay loam and loamy sands. There are two cropping seasons i.e. Rabi (winter) and Kharif (summer). Main Rabi crops are wheat, sugarcane, pulses, and fodder while corn, paddy, cotton, sugarcane, and fodder occupy lands in kharif season.
Land degradation due to
hydro-salinity in semi-arid regions Using gis and remote sensing
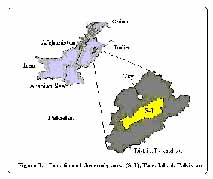
Table 1. Waterlogging and salinity situation in the Fourth Drainage Project in January 1983.
|
Status |
Salinization |
Watertable Position | ||||
| Area (%) | Salt Free | Saline Sodic | Saline-Non Sodic | 0.00-1.5m | 1.50-3.0m | >3.0m |
| 57 % | 35 % | 8 % | 77% | 21 % | 2 % | |
Data Used
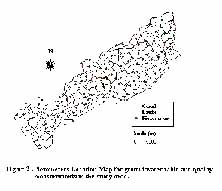
Two types of data have been used in this study, i.e. satellite and field data. Satellite data of IRS-IB, LISS-II (linear image self-scanning spectrometer) in all four bands (B1: 0.04-0.52um, B2: 0.52-0.59um, B3: 0.62-0.68um and B4: 0.77-0.86um) are used for three time periods of year1993. Three different months have been chosen for the satellite data because of considerable variation in salinity as well as in vegetation cover. Topographic maps of survey of Pakistan used in the study were 44 E/3, 44 E/7, 44 E/8 and 44 /16 of scale 1:50,000. Layout maps of irrigation canal and surface drains were also used. The watertable data for more than 150 Piezometer locations (Figure. 2) lies within the S-1 area were used to know the status of soils under waterlogging risk. ILWIS 2.2 for Windows system has been used for all remote sensing and GIS analysis. Information about water and soil quality, soil types, agricultural practices, crop yield, irrigation facilities and necessary ground truth data of the study area will be obtained and used in the remaining part of the study.
Study Approach
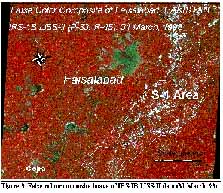
The IRS LISS-II digital data were registered to Survey of Pakistan topographical sheets using an image-to-map registration algorithm (UTM map projection with 36.25m ground resolution). About 30 common, well identified and uniformly distributed GCP points were selected from both, the displayed image and topographical sheets. The image was then registered using affine transformation method and the nearest interpolation was used for arrangements of the coordinates of each picture element. The average error was within one picture element in terms of precision after the geometric correction. Following this procedure, the others scenes were registered through image-to-image tie-down algorithm using ILWIS 2.2 for windows. False color composite (FCC) image was generated using band combination of R:G:B = 4:3:2 for better and visual interpretation of salt-affected lands in contrast to other features (Figure 3).
Unsupervised classification was performed, as the complete site information was not available. It involved various processes like image enhancement, creating composite files, using cluster/ iso-cluster modules etc. Various salinity indices were also applied based on the concept of spectral response of salt-affected soils. It is to note that spectral response in terms of digital no. (DN) of salt-affected soils is relatively higher than other categories in band-1 (B1) and band-3 (B3). The following two salinity indices namely S.I (Salinity Index) and NDSI (Normalized Differential Salinity Index) proposed by Tripathi et. al. (1997) were applied which relatively give good results in re-classification of salt-affected lands. NDSI is just the reverse of NDVI index for vegetation.
S.I = (Band 1 X Band 3) ½ (1)
NSDI = (Band 3 - Band 4) / (Band 3 + Band 4) (2)
The strongly visible salt-affected lands were then extracted from the final classified image to make a thematic map. The sum of all the extracted salt-affected soils was prepared, considering the rest of area as slightly saline to normal lands (Figure 4). Depth to watertable data for the year of 1990, 1993, and 1996 for more than 150 piezometer, reported by JIID (1997) along with their GPS locations, were used to see the spatial watertable positions in the area.
Using moving surface interpolation technique, initially the average watertable positions maps were prepared and analyzed for each year and then a map of "mean watertable positions" based on the three year results, was prepared. It is further grouped as waterlogged and non-waterlogged conditions, assuming an assumption of critical watertable depth of _ 200m for the area (Figure 5).
Reflectance variations of vegetation on the image are attributed to the different species of vegetation and their densities, which together provide evidence of shallow ground watertable conditions and saline agricultural areas. Favorable growth conditions prevail in regions where the watertable is situated below the area of influence of evapotranspiration, that is, within 10-m depth (Srivastava 1997). An indication of whether scanty vegetation in an area is due to high watertable depth or salinity can be investigated using Normalized Differential Vegetation Index (NDVI)
which easily grasp the state of vegetation. The NDVI for the area can be expressed as:
NDVI = (NIR Band _ Red Band) / (NIR Band + Red Band) (3)
The maps of irrigation canals and surface drainage network were digitized in the GIS environment. Some discrepancies of mismatching were found when overlaid on the geo-referenced image. These layers then were corrected with the help of topographic maps and image. It was presumed that the topographic sheets could be the most reliable source of information. Buffering analysis along canal and drain channels was performed for 1000m corridor to see the hydro-salinity impact on productivity in terms of vegetation vigor.
Result and Discussion
Waterlogging and Salinization The IRS composite image was systematically visually interpreted with the help of old salinity maps/ information developed in early 80's. It is revealed that salt-affected and waterlogged areas are clearly delineated compared with other land use features in FCC pellet. The most of the salt-affected lands were observed more pronounced near the drainage network as shown in white to light bluish tones. JIID (1997) and Casas (1995) reported similar results. This could be best
This could be best explained, as the watertable along the drainage canals has found shallower relatively due to low location. The irrigation canals are constructed on relatively high locations comparing to the drainage system to utilize the natural gradient effectively. The occurrence pattern of salt-affected soils through unsupervised classification method was grouped into two main classes i.e. slightly to normal saline and visible salt-affected soils. The existence percentage of salt-affected soils was found to be 7.5 % for the mapped area of S-1 unit. Map of 'mean' depth of watertable shows the extent of waterlogging (area _ 200cm) in the area. The yearly average watertable analysis indicates the lowering trends during 1990-93 from 24.5 % to 22. %. However, it started increasing tremendously by 39 % in 1996. This situation is quite alarming when comparing the change of watertable for the 7 years period gape. Low with-drawl from the sumps, low natural drainage to the aquifer, deterioration of many vertical drainage system (tube-wells), choking of various sub-surface drainage lines by debris like weed growth and silting have appreciably contributed to the rising of watertable (WAPDA, 1997). All other sources of recharge and discharge of groundwater reservoir are, more or less, the same except the unpredictable rainfall pattern but it hardly cause any big change in the hydraulic balance of the area. Many farmers were reported for re-use of poor quality drainable surplus to supplement irrigation needs. Most of the farmers complained water shortage in the socio-economic survey (WAPDA/SMO, WM&E, 1993-94) for the whole area, especially, big percentage for the tail-end users. Inequity water distribution were also reported among the shareholders of a watercourse at the head, middle and tail reach.
Agro-Productivity in Relation to Hydro-Salinity The results of the vegetation index (NDVI) were analyzed along the irrigation and drainage channels (the area under easy risk of hydro-salinity) indicated rather scarcity of vegetation as a whole (Figure 6). Relatively healthy growth of the green bio-mass were observed along the canals than that along the drains. Easily visible high NDVI were noted for a private agricultural model farm (Sehgal model farm) near the FDP area for all periodic NDVI images, except fellow lands. It is due the fact that the water management is demand oriented there (3-times more water allocation
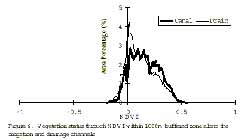
Figure 6. Vegetation statusthrough NDVIwithin 1000m buffered zone along the irrigation and drainagechannels.
i.e. 4.7mm/d than the average of FDP area as 1.54mm/d), thus more flexible with sufficient water supply. The design irrigation allocation (1.8-2.1mm/d) for the area is half of average crop water requirement (JIID, 1997). These results clearly show the possibility of resolving the remaining salinity problem out of area. The NPP (Net Primary Productivity) for natural vegetation corresponding to the annual precipitation range of about 300mm was too small and quite sensitive to changes in the rainfall pattern (JIID, 1997). As NPP is closely related to the agricultural productivity in rainfed farming, it is certain that ample irrigation supplies are necessary to obtain sustainable agriculture in the area.
Conclusion
Composite image and unsupervised classified image shows that most of waterlogging and salinity problems are located along the drainage canals. The existence percentage of salt-affected soils was found to be 7.5 % for the mapped area of S-1 unit. Th situation of waterlogging is quite alarming when comparing the change of watertable for the 7 years period with the lowering trends from 24.5% to 22% (1990-93) and clear increase by 39% in 1996. Evidence is presented that the existing drainage system along with use of groundwater for irrigation reduces the extent of waterlogged soils. However, the reuse of poor quality water to supplement irrigation supplies by the downstream farmers and the failure of a few drainage sumps are likely to disturb the water balance resulting into increased risk of waterlogging and salinity in the area. The vegetation growth analyzed through NDVI tends to be lower along drainage and higher along the irrigation canals due to the inequity water distribution and locational disadvantage of the drains and vice versa. High NDVI values for almost all over the model farm near FDP project area with demand oriented water supply thus gives the solution to resolve the remaining salinity problem. Lastly, it is concluded that the water shortage is one of the fundamental problem in the area to reclaim the soils for sustainable productive lands.
References
Casas, S., 1995. Salinity assessment based on combined use of remote sensing and GIS. Use of Remote Sensing Techniques in Irrigation and Drainage, pp. 141-150, FAO, Rome, Italy. JIID, 1997. Study on Establishment of a New Monitoring System for Land and Water Resources Management in Arid Area. (JIID), Main Report, 254 p.
SMO (M&E Directorate, WAPDA), 1994. Annual report. M&E, FDP Project. Vol.I. Text Pub. 237. Srivastava, A.,Tripathi,N.K.,and Gokhale, K.V.G.K.,1997. Mapping groundwater salinity using IRS-1B LISS II data and GIS techniques. Int. J. Remote Sensing, vol.18, NO.13,pp.2853-2862. Tripathi, N.K., Rai, B.K., and Dwivedi, P., 1997. Spatial modeling of soil alkalinity in GIS environment using IRS data.18 th Asian conference on remote sensing, Kualalampur, pp.A.8.1-A.8.6.
WAPDA, 1997. Monitoring and Evaluation Fourth Drainage Project, WAPDA, Lahore, Pakistan.