| GISdevelopment.net ---> AARS ---> ACRS 2000 ---> Agriculture |
MODELLING TEA (Camellia (L)
O. Kuntze) YIELD USING SATELLITE DERIVED LAI, LANDUSE AND METEOROLOGICAL
DATA
R.M.S.S. Rajapakse*, Nitin
K. Tripathi**, Kiyoshi Honda***
Space Technology Application and Research Program,
Asian Institute of Technology,
P.O. Box 4, Klong Luang, Pathumthani, 12120, Thailand
Tel (66-2)-524-5577 or (66-2)-524-5670
Fax (66-2)-524-5597
Email - stb997175@ait.ac.th
Space Technology Application and Research Program,
Asian Institute of Technology,
P.O. Box 4, Klong Luang, Pathumthani, 12120, Thailand
Tel (66-2)-524-5577 or (66-2)-524-5670
Fax (66-2)-524-5597
Email - stb997175@ait.ac.th
Key Words: LAI, NDVI, TEA YIELD MODELLING
Abstract
Tea is very important cash crop for Sri Lanka as it is the number one foreign exchange earner. Monitoring tea yield is vital from both management of tea plantation and commercial purpose. Tea yield depends on various land use and environment parameters. Remote sensing provides useful information on existing crop condition. In this analysis an attempt has been made to predict tea yield using remote sensing and other key parameters in GIS environment.
Leaf area index (LAI) is one main key factor useful in crop growth models that may be derived from optical remote sensing data. The LAI during the plucking stage is an important state variable in tea yield modeling. The LAI is a major factor determining crop reflectance and is often used in crop reflectance modeling. Therefore, the relationship between tea LAI and optical remote sensing parameter (NDVI) was investigated and this is very important in developing yield prediction models for tea. A model with a logarithmic function was adopted to find the relationship between NDVI and measured LAI.
Satellite derived LAI values and existing spatial, meteorological and agronomic variables with statistical regression analysis and analytical capabilities of GIS were used to develop a model for tea yield estimation. Although different methods were tried to find the best model by using multiple regression, a model develop by using weights of considered variables selected as the suitable model for predicting tea yield.
1.Introduction
Tea (Camellia sinensis (L) O. Kuntze) plantations are very important for Sri Lanka as in terms of land use and employment, tea industry occupies the foremost place in the island. Develop a model to forecast or estimate tea yield is very useful for decision making in tea industry. Remote sensing and GIS technologies has been used during last decade for this purpose for develop yield prediction models for several annual crops like rice, wheat etc. Therefore, development of a yield prediction model using remote sensing and GIS for tea, a very important perennial crop is pressing need. The lack of previous studies in monitoring tea using remote sensing provided the main *Master student, AIT and Experimental Officer, Tea Research Institute of Sri Lanka.
**Assistant Professor
***Associate Professor
imputes for this study. LAI plays an important role in both the processes of crop growth and canopy reflectance (Clevers et. al., 1994). Measuring LAI in the field is time consuming. Therefore much relative benefit might be obtained from the estimation of LAI from optical remote sensing data. The normalized difference vegetation index (NDVI) could be considered as a measure of plant productivity (Sellers, 1985). NDVI has been considered a measure of LAI for most of crops (Gong, P. et. al., 1995). Objectives of this study were to develop a model for estimating LAI using optical satellite data and to develop a model for estimating tea yield using LAI, agronomic, landuse and meteorological parameters.
2. Methodology
2.1. Study area
A mid country tea estate situated in Nawalapitiya, Dolosbage planting district of Kandy administrative district in Sri Lanka was selected as the study area. Total land area of the estate is 945ha and 235.25ha is under tea plantation. Balance area is under fuel wood, paddy, vegetables, a tea factory and settlements. Whole estate consists of 50 tea fields respectively. The location of the estate is between 197000mN, 176000mE and 201000mN, 180000mE local coordinates. Several clones of vegetatively propagated tea can be seen in the estate; TRI 2025, TRI 2023, CH13, DN and TRI 2026. All most all seedling tea fields are more than 80 years old. Slope of the estate is less than 53%. Elevation range of the estate varies from 1000m amsl to 1500m amsl. Cumulative annual rainfall of the estate is greater than 2000mm. Average relative humidity of the estate is between 84%-90% and average daily temperature is between 21 0 C to 23 0 C. The base temperature for tea is 13.5 0 C. Therefore this estate has a suitable temperature range through out the year. Daily average sunshine hours of the estate are 5.2 hours.
2.2. Data collection
This study considered both attribute and spatial data. The attribute data was collected from tea estate records, meteorological records and by measuring field-by-field Leaf Area Index. The spatial data is extracted from satellite images and existing maps. These spatial and attribute data were linked within a GIS database. Existing maps were used to prepare digital coverages of field boundaries, landuse, soil boundaries, road and stream network, slope, elevation and aspects. Using inverse distance interpolation (IDW) method annual cumulative precipitation, average daily relative humidity, average daily sunshine hours and average daily temperature maps for the estate were prepared. Tea plantation parameters concerning acreage, variety (clone), planting density, soil cover by the canopy, pruning cycle, planting date and yield were collected. These data were collected from tea estate records.
Each and every tea field leaf samples were collected for measuring LAI. Sampling was done in 50 fields of the estate. Sample size was 1 square meter. Ten random sampling points per field were selected from each field. Leaf area was measured by using Decagon pseudocolor Ag vision image analyzer. Following equation was used to calculate LAI by point-by-point basis:
LAI = Leaf Area / Sample surface Area
However, when considering satellite images actual coverage of tea plant canopy has to be considered. Therefore measured leaf area readings and fields by field plant density records were used to calculate LAI by using following formula. Leaf area and sample ground surface area should be in same units.
LAI = Leaf Area / (Sample Surface Area X Actual Coverage)
Actual Coverage = Actual Plant Density / Optimum Plant Density
Where; For Vegetatively propagated tea with 0.6mx1.2m spacing; Optimum tea plant density = 13800 plants per ha For seedling tea with 0.9mx1.2m spacing; Optimum tea plant density = 9250 plants per ha Sample surface area = 1m 2
2.3. Satellite data
Radiometric normalization was done to remove inherent noise in multi-temporal LANDSAT-TM images. Linear transformation was done for radiometric correction. The IRS-1C LISS III (Linear Imaging Self Scanner) acquired on 12 th February 2000 and LANDSAT-TM image acquired on 6 th March 1995 were used in the study. After performing geometric correction, radiometric normalization and masking for assigning null value to non vegetation areas of images NDVI values were calculated by using field boundary vector file as ROI (region of interest).
Non-vegetation areas include water, buildings and roads etc. Masking was done by detecting all NDVI responses less than zero and assigning the pixels a null value. NDVI values were calculated with formula expressed below;
NDVI = (NIR - VR) / (NIR + VR)
NDVI is a measure of chlorophyll abundance and energy absorption (Mynen iet. al., 1995). Band 4 of LANDSAT-TM and band 3 of IRS-1C receives the maximum
of the chlorophyll reflectance, while band 3 of Landsat-TM and band 2 of IRS-1C is the chlorophyll absorption band. Vector layer of the estate field boundary map was overlain and used as regions of interest to get statistics of mean NDVI value for each field.
2.4. Model 1- Model for estimating LAI using satellite derived NDVI
NDVI values derived from IRS-1C satellite image were used for this model development. Out of Landsat-TM and IRS-IC only IRS-1C satellite image was used for this as it was acquired on one of the sampling date. Several univariate linear and nonlinear prediction models were used. Gong, P. et. al.(1995) also tried several functions for develop a model for estimate coniferous forest LAI using NDVI and conclude a hyperbolic is the best model for estimating LAI using NDVI.
2.5. Model 2 - Model for estimating tea yield
All digital coverages were used for assessing modeling parameters specific to tea plants. In order to estimate LAI from all existing variables multivariate relationships between tea yield and other variables were investigated. These variables were slope, aspect, elevation, age of the tea plantation, type of tea, relative humidity, annual cumulative rain fall, average daily temperature, average daily sunshine hours, soil depth, rock cover percentage of the field and leaf area index. However, average daily temperature and daily sunshine hours parameters were not considered for the model development as temperature and daily sunshine hours do not show any variations in field-by-field basis of the estate. To find the parameter weights univariate relationship between LAI and all existing variables were investigated. Using these correlations weights were assigned to each variable and empirical relationship between average yield and other parameter weights was investigated.
3. Results and Discussion
3.1. Model 1- Model for estimating LAI using satellite derived NDVI
The spectral data corresponding to 40 LAI measured fields were extracted from the IRS-1C February 2000 image. NDVI were calculated for those images. Several linear and non-linear models were tried to the relationship between LAI and NDVI derived from IRS-1C satellite image. Out of all a logarithmic function considers as the best goodness of fit by considering all cases for estimate LAI using satellite images. Models adopted to find the relationship between NDVI and LAI for satellite image presents in Figure 1.
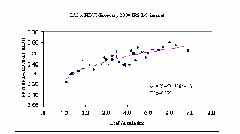
Figure 1 - The relationship between NDVI and LAI for IRS-1C image
3.2. Model 2 - Model for estimating tea yield
Variable weights were assigned by finding the univariate relationship between each variable with yield. Weights for classes within each variable were assigned by using ARCVIEW analysis technique, which is yield summarized within the zones of reclass of each variable. Class weights were assigned by considering the yield of each tea field summarized within the zones of each variable. After assigning weights for all classes in available variables the relationship between yield and weights of classes were found using backward regression analysis. 5 models were obtained using backward regression analysis technique. Following model considered as the best model because, soil depth and rock cover percentage are very important factors for tea plant growth. Slope is also very important factor but Tea Research Institute of Sri Lanka is not recommending to plant tea in more than 55% slope lands in mid country region and more than 70% slope in up country region. Therefore, this factor is excluded.
Model 2
Yield = -603.923 +50.124wd - 23.5wr - 14.049wl + 65.845wi + 513.54wa +39.54wh + 65.695wf + 46.338we
For Model 2-3 r 2 = 0.742; F = 1575.083
Where; wd = Soil depth weight wr = Rockiness cover weight wl = Landuse type weight wi = LAI weight wa = Age of tea plantation weight wh = Relative humidity weight wf = Rainfall weight we = Elevation weight
3.3. Model validation and application Validate the model 1
Model developed for estimate LAI using IRS-1C image was validated using t test by using holdout samples. The calculated t value (0.1367) is less than the tabulated t value (1.7247). Therefore the null hypothesized cannot be rejected and can be conclude that there is no significant difference between actual and measured LAI values. Therefore the model developed for estimate LAI by using satellite image derived NDVI values is valid with 95% significant level.
Validate the model 2 by using holdout samples and February, 2000 IRS-1C image
The selected model 2 was validated using t test by using holdout samples. As the calculated t value (-0.197) is less than the tabulated value (1.745), the null hypothesis of no difference between actual and predicted yield cannot be rejected. Therefore actual yield does not differ significantly with predicted yield using the model developed for predict yield by using measured LAI values, other meteorological, agronomic parameters and is valid with 95% significant level.
After normalized March 1995 Landsat-TM image NDVI values of the tea fields were calculated. Model 2-B-3 was used to estimate 1995 yield. Estimated and actual tea yields were compared using t-test. The calculated t value (1.467) is less than the tabulated t value (1.669). Therefore the null hypothesized cannot be rejected and can be conclude that there is no significant difference between actual and estimated yields. Therefore this model can be used to estimate yield with 95% significant level. Actual tea yield for the whole estate is 1144 made tea kg ha -1 annum -1 for 1995.
Estimated tea yield for the whole estate for year 1995 is 1031 made tea kg ha -1 annum -1 .
4. Conclusion
Logarithmic function gives a good relationship between NDVI and LAI. This model can be adopted to estimate LAI of particular tea field using NDVI value of satellite images. The model develops by using weights of all variables give best correlation of determination. In this multivariate regression analysis all variables were considered. This method gives five models with backward regression and the model with eight variables selected as the best one out of these five as it gives 95% validity with holdout samples and could be able to estimate 1995 yield. Therefore this model (Model 2) is used for estimating tea yield.
5. Acknowledgement
The authors are grateful to Kahawatte plantation Ltd, Sri Lanka for giving permission to utilize Westhall estate for the study, Institute of surveying and mapping, Diyatalawa, Sri Lanka for providing a GPS system and Tea Research Institute of Sri Lanka for providing necessary facilities to carry out the study.
6. References
Cleves, J.G.P.W., Buker, C., Van Leeuwan, H.J.C., and Bouman, B.A.M. (1994) A Framework for Monitoring Crop Growth by Combining Directional and Spectral Remote Sensing Information, Remote Sensing Enviroment, 50: 161-170
Gong, P., Ruiliang, Pu, and Miller, J.R. (1995) Coniferous Forest Leaf Area Index Estimation along the Oregon Transect using Compact Airborne Spectrographic Imager Data, PE&RS, 61-9:1107-1117
Myneni, R. B., Hall, F. G., Sellers, P. J., & Marshak, A. L. (1995). The interpretation of spectral vegetation indexes. IEEE Transactions on Geoscience and Remote Sensing, 33(2), 481-486
Selleres, P.J., 1985, Canopy reflectance, photosynthesis and transpiration, International Journal of Remote Sensing, 6, 1335-72