| GISdevelopment.net ---> AARS ---> ACRS 1999 ---> Water Resources |
Monitoring Soil Water
Contents in Tarim River Area Using NOAA/AVHRR Data
Liu Peijun Song Yudong
Alishir Kurban Fan Zili Zhang Lin Wang Ranghui
Xinjiang Inst, of Ecology and Geography, CAS, Urumqi, 830011
Xinjiang Inst, of Ecology and Geography, CAS, Urumqi, 830011
Tarim river is located western China. It is the longest continental river in China. The annual precipitation is tens mm in this area. The river is over one thousand Km in length. The monitoring and providing fast soil water information for agricultural, stock raising and water conservancy departments using NOAA/AVHRR data are very important.
1. Cardinal Principle
The soil spectrum relates to its mineral composition, organic matter, water etc. if other factors are fixed, the soil spectrum and the soil spectrum and the soil water contents are interrelated [1]. This relation is relatively sensitive to the second channel [2]. Their related formula is as follows:
Where: P is the soil water contents (%); R2S is reflectance (%) of the second channel of soil; A and B are the parameter.
The vegetation influences strongly on the remote sensing data of soil water contents. The decomposition pixel method can be remove the interference of vegetation. The vegetation cover interference value is weighed by the "Optical Vegetation Coverage[3]". Its express formula is as follows:
Where: Cov is optical vegetation coverage; R2 and R1 are respectively the reflectance (%) of the second and the first channel; R2v and R1v are respectively the reflectance (%) of the second and first channel at the full of vegetation cover, r50 is a constant, which is the difference of soil reflectance between the second and the first channel. The above spectrum parameters are calculated on the spectrum data, which are measured in the field.
A pixel consists of two information of soil and vegetation. If R2S is the soil reflectance of the second channel, R2v is the vegetation reflectance of the second channel, and then the composition value (R2) is as follows:
Based on (1)(2)(3) formula, we can set up the model extracted soil water information by NOAA data.
2. Monitoring Model for Soil Water Contents
2.1 Calculation and correction of A and B in Model (1).
Collecting the sample of principle soil types (7 types), measuring its reflectance in the various soil water contents condition at outdoor, to calculate the A and B in the model (1) using regression method. Because of the difference between state simulated soil water and natural soil water, the A and B calculated using simulated method is lower than reality, using the parameter calculated based on 24 samples data observed in the field corrected them. The correction coefficient fA is 2.630, fB is 2.422. The A and B simulated method times respectively fA and fB they are corrected.
It is obvious that precision of the soil water calculated based on A and B of every soil type ought to be higher. If there is no the soil type data base, to use the weighed average of various soils parameter A and B. In result, the weighed average of A is 173.88, B to 46.14.
2.2 Calculation of rso, R1v, R2v in Model for Remove Interference of Vegetation.
Based on 173 soil samples and soil interrelated map, to calculated the weighed average of rso its result is 6.28 in this area; based on 8 vegetation samples, R1v is 11.77, R2v is 70.58. Substituting these data in formula (2) and (3), can find solution R2S (i.e. the remote sensing data removed interference of vegetation).
2.3 Model Operation and Its Parameter Regulation.
Because of the complication of real earth's surface, more factor, the difference of eave band response and sensitivity between field operating spectrometer and satellite sensor, etc., the model's parameters need operation test and regulation. The regulation method is as follows: Operating computer-model system, watching monitor screen (or printing map or data), regulating A and the constant in formula for R2s based on the known number of samples data, making result, model's complex function is as follows:
Where: P is soil water contents (%), R2s, R1, R2 are the same as above.
3. The distribution Map of Soil Water Contents.
Based model (4), operation computer, exporting the map of soil water contents in the form of monitoring screen or photo or printing map. In order to avoid the broken bits of map, and consider the suitable and harmful the limits of soil water contents for staple vegetation (diversiform-leaved poplar, tamarisk, meadow, crop), the soil water contents are divided 6 grades, i.e. <5%, 5-11%, 11-16%, 20-25%, >25% (Fig.1 and Fig.2). The data shows the average soil water contents in 10mm inner surface layer soil.
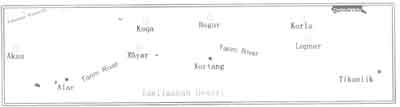
Fig 2. Distribution of Soil Water Contents in Tarim River Area on May 21, 1993.
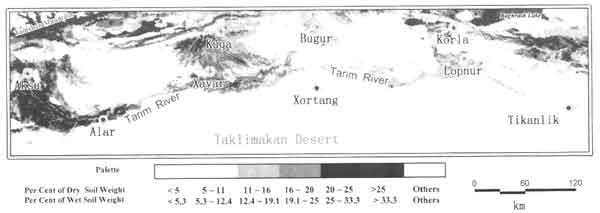
Fig 2. Distribution of Soil Water Contents in Tarim River Area on August 23, 1993.
4. Discussion
4.1 The maps of soil water contents distribution confirmed to reality regularity:
- along with distant place of river bed, the soil water contents reduced gradually, due to the underground water reduced gradually;
- in the same year, the soil water is more in August than May, due to August is in flood, floodwater irrigation and soil water supplied increased;
- the soil water is more in May, 1994 than in May, 1993(Fig.1 and Fig.2), because 1994 is good flood year, 1993 is lean floodwater year, their spring floodwater is different.
References
- Liu Peijun et al., A method for Monitoring Soil Water Contents Using satellite Remote Sensing, Vol.1, No.2, Beijing, China, 1997.
- Wang Ranghui et al., Selection of Sensitive band for Remote Sensing Soil Water in Arid Area, Xinjiang Meteorology, Vol.18, No.5, Urumqi China, 1995.
- Liu Peijun et al., An Estimate Method of Optical Vegetation Coverage Using TM Data, Remote Sensing Technology and Application, Vol. 10, No.4 Lanzhou China, 1995.