| GISdevelopment.net ---> AARS ---> ACRS 1999 ---> Water Resources |
The Research of Urban
Waterlogging-Dragging Decision Support System Based on GIS
Li Jun, Bian Fuling, Hu
Zifeng
Informatics School of Wuhan Techinical University of Surveying and Mapping
Luoyu road 129#, Wuhan, China, 430079
Tel: (86)-(27)-87646560 Fax: (86)-(27)-87646560
E-mail:1j_2000@263.net
Informatics School of Wuhan Techinical University of Surveying and Mapping
Luoyu road 129#, Wuhan, China, 430079
Tel: (86)-(27)-87646560 Fax: (86)-(27)-87646560
E-mail:1j_2000@263.net
Abstract: this paper studies urban waterlogging-draining decision support system on basis of the application techniques, it employs 4D and visualization techniques to organize all data that needed, and to reach the functions of the system. At last, it gives a real case: Ezhou Waterlogging-Draining decision Support System.
1. Introduction
China is a country that suffers many natural disasters, each year the losses on this item occupies 3 to 5 percent of National Gross Product, flood and waterlogging are major factors in natural disasters, and flood always accompanies waterlogging. In recent years, the losses caused by flood and waterlogging increased steadily. In some areas, the waterlogging expense is even higher than flood expense. In China, almost half of the National Gross Product distributes in relatively lower areas such as seaside, riverside, lakeside etc. when flood seasons comes, heavy rainfall down in very short time; sometimes during this period it could occupy 80 percent rainfall of the whole year. The water level around the city keeps very high and created great pressure for city to discharge it, this could lead to urban waterlogging when water takes accumulating is such areas. With speeding urbanization, the likelihood of waterlogging caused by frequent rainstorms is getting bigger. Thus, to build urban waterlogging-draining decision support system is necessary, it could improve the forecasting and evaluating work for urban waterlogging, to supply scientific proof for waterlogging-draining decision and waterlogging-preventing plan decision. Through scientific analysis it can be relieve the losses in best way and achieve great economic and social value.
2. Data Structure and analysis Result Display of Urban waterlog-Draining Decision Support System.
2.1 Techniques Being Employed
Urban Waterlogging-Draining decision Support system concerns a huge amount of basic Information, including satellite images, aerial photographs, traditional topographic maps etc. These raster data and vector data, according to their different use, different layer and different class, through means of digital photogrammetry, are processed to get digital surveying information products based on 4D. 4D include Digital Elevation Model (DEM), Digital Othophoto Quadrangles (DOQ), Digital Raster Graphics (DRG) and Digital Line Graphs (DLG). 4D technique can complete information merging of raster and vector data, overlap multi-layer information of different structure. After correction and rectification of raster data, then matching with vector data, users can analyze the overlay graph of raster-vector data comprehensively and extract information being interested in.
As the key point for Decision Support System is assistant decision, an important factor that influences the system analysis outcomes to the users. Using 2D or 3D figures to display features and areas affected by waterlogging, using different means (zoom in, zoom out, pan and flash etc.) to highlight interesting geographic features, all these are needed to be done based on visualization technique. As elevation information's been stored as an attribute value, so basically this data does not has 3D GIS data structure. Through it will encounter some problems in making 3D analysis based on the data structure of DEM, the terrain information can completely satisfy the analyzing operations on rainfall-water level model and water depth distribution model. In application, it adopts 2D analysis combining with simulation display.
2.2 Data Organizing
Raster data: Dem, DOQ, DRG database on the whole area.
Vector data: multi-theme DLG database, storing spatial data such as boundary, stream system, traffic, pipe lines and water conservancy facilities etc.
Non-spatial infrastructure information database: the information about real time meteorological references, historical rainfall recordation, historical water level recordation, historical water level recordation, draining facility descriptions, policies and statutes on waterlogging-draining, traditional working experiences against waterlogging.
The system designer can choose the type of database for spatial and non-spatial and non-spatial data: Distributed Database or Centralized Database, Relational Database or Object-Oriented Database.
3. Major Targeting Objectives of Waterlogging-draining Decision Support System
3.1 Comprehensive Information Query
In order to assure the reliability of system analyzing results, it's necessary to assure all information being input into the system are correct and well organized. These data consist of multi-region, multi-theme files such as DEM, DOQ, DGR, DLG, and other information including real time rainfall, water level and location distribution of waterlogging-draining facilities etc.
More accurate outcomes can be reached by querying users if the information is renewed frequently and correctly. Tables, word descriptions and vivid figures (histograms, pie chart) are effective means to tell users what they need. This is another visualization on geographic information.
3.2 Disaster Forecasting and real time Disaster Analyzing
Disaster Forecasting and real time Disaster Analyzing are prerequisites and foundations for assistant decision. During disaster weather, system receives rainfall data, sends it to analyzing module, then system will evaluate regions suffering waterlogging on considering the terrain of the region. On the basis of rainfall-water level model and digital elevation model, it supplies maps on waterlogged area and interesting features inside it.
According to rainfall forecasting, system uses figures to vividly display the range of possible waterlogging areas and water depth distribution maps. After vector-raster data matching, system overlaps DOQ and DLG of specific theme to get numerical statistic on a theme, such as urban retaining water capacity, waterlogging losses evaluation, all influenced industrial centers etc.
3.3 Waterlogging-Draining assistant Decision
After disaster forecasting and real time disaster analyzing system lists all possible waterlogging-draining plans, puts them into analysis module, then users will get different real time scenes after system performs to simulate outcomes by draining plans. After draining management, system hands all plans and their effects to professionals to decide, the effects include regions about to the submerged, regions already been submerged, waterlogging conditions of key departments and key areas, losses due to waterlogging. After making integrated management and comprehensive comparison to all plans, experts will finally decide the best solution to waterlogging disaster.
3.4 System Flow Chart
Fig. 1 shows system flow chart of Waterlogging-draining Decision Support System.
Fig1 System Flow Chart
4. Ezhou Waterlogging-Draining Decision Support System
4.1 General Situation of Ezhou City
Ezhou City is located in north of Hubei province. Chinese biggest river-Yangtse River passes on north edge of its urban area. Ezhou contains an inland lake that is called yangLan Lake. YangLan Lake centers Ezhou City, and is lower than surrounding urban areas. Converging area of YangLan Lake is 62 square kilometers. The elevation of the lake bottom is 13.63m (1998.7), and the elevation of dike is 18.0m. There are always big amount of water exchange between YangLan Lake and Yangtse River. In dry season, wateer is pumped from Yangtse River to YangLan Lake, in rainy season, just on the contrary to prevent waterlogging along lakeside. Ezhou City belongs to rainstorm frequent occurring areas in China. On Jul. 21st, 1998, heavy rainstorm attacked Ezhou and kept for 2 days, the rainfall exceeded the water containing capacity of Yangtse Lake. Because of lacking weather forecasting and rainfall assessing, it has not been done to pump water from Yangtse Lake to Yangtse River in advance, hence most areas on lakeside suffered waterlogging.
Fig2 shows the map of urban geographic location of Ezhou city.
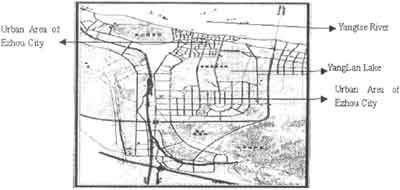
Fig2 Urban Geographic Location of Ezhou City
4.2 Fundamental Data of the system
DEM files of Ezhou urban area, scale 1:5000, closest grid interval: 5m, elevation accuracy: 0.1m, text files.
DOQ of Ezhou urban area, scale 1:5000, tiff files.
Frame features overlapped with DOQ of Ezhou urban area, scale 1:5000, text files.
DLG on frame features of Ezhou urban area, scale 1:5000, dxf files. The frame features are fundamental geographic information such as district boundary, river system, traffic line etc.
4.3 System Functions
System database management is based on file system, which includes DEM, DLG, DOQ database. It takes Ezhou coordinate system as planar coordinate system, takes national elevation datum in 1985 as elevation system. Each data files boundary has no intersections with others and all the files outing together cover the whole Ezhou urban area and YanLan Lake area. System can do query and statistical computation on information in database, all based on standard SQL rules.
According to rainstorm forecasting and relational model of rainfall and water level, system forecasts and judges whether the water level of the lake reaches the alarming level. Based on DEM of urban area, small range of water surface could be considered as water plane. With the plane model and DEM, system completes urban terrain section analysis and slope analysis, computes waterlogged area on supposed water level condition or real time condition, and judges the grade of the waterlogged area. Overlapped theme DLG with influenced area maps, system assesses possible losses according to the social economic information stored in spatial database. After putting forward urban waterlogging-draining plans, system employs visualization technique to display certain local environment, compare differences between pre-decision and post-decision conditions. In order to give a better understanding to what will happen after taking a certain waterlogging-draining plan, a few ways were used to improve the visual effect such as zoom in, zoom out, pan, rotate, render etc.
Ezhou Waterlogging-Draining decision Support System is in the process of improvement and development. It's running now in Ezhou Urban Planning Bureau. Fig3 shows simulating waterlogged area map based on DEM and DLG overlay when water level is 19.5 m , fig4 shows planar overlay analysis in the system, all the important features that suffer waterlogging are listed in the table and rendered on the map based on the instant-generated waterlogging map.
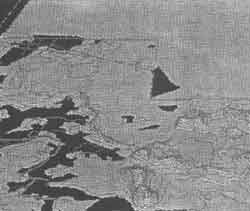
Fig3. Simulating Waterlogged Area Based on DEM and DLG Overlay (Water level: 18.5m).
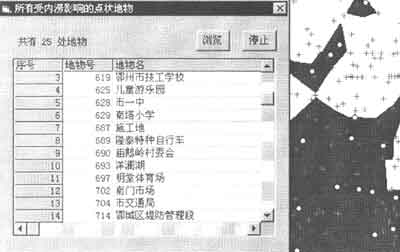
Fig4 Planar Overlay Analyzing : all-important point features suffering waterlogging (dots in waterlogging area).
The system is praised for its practicability and high efficiency in the application.
References
- Chang Yanqin, Zhang Fuhao, Flood Inundation Simulation and Analysis System Using Vector-Raster merging Technique, Remote Sensing Information, 1998, supplement,pp.80-83.
- Liu Jiping, General Description on Key Techniques of Flood-Control Information System Supported by GIS, Remote Sensing Information, 1998, supplement, p17-20.
- Liu Jiping, Research and Develop on Regional Water Conservancy Facility Management System based on GIS, Remote Sensing Information, 1998(1), p24-28.
- Li Ziwei, Flood Forecasting and Assess Running Serving System Based on 4D Technique, Remote Sensing Information, 1998(3), p5-8.
- Lin Zongjian, the application of 4D Technique in Flood-Control and Disaster Relief, Informatics and its Application, p9-12.
- Zhao Rui, Dynamic Decision Advising system of ChangJiang River delta-Integration Application of RS and GIS Technology, The Proceeding of GIS AM/FM Asia'97 & Geoinformatics'97 , Taipei, p799-801.