| GISdevelopment.net ---> AARS ---> ACRS 1999 ---> Water Resources |
A Fusion Approach of Multi
-Spectral with SAR image for Flood Area Analysis
S. Wisetphanichkij, K.
Dejhan, F. Cheevasuvit, S. Mitatha, I. Arungsrisangchai, S. Yimman
Faculty of Engineering and Research Center for Communication and Information Technology
King Mongkut;s Institute of Technology Ladkrabang, Ladkarabang, Bankok , Thailand
Tel: 66-2-3269967 , 66-2-3269081, Fax :66-2-3269086
E-mail : kobchai@telelan.telecom.eng.kmitl.ac.th
C. Pienvijarnpong
National Research Council of Thailand
MOS-1 Receiving Ground Station, Ladkrabang, Bangkok 10520, Thailand
C. Soonyeekan
Aeronautical Radio of Thailand
102 Ngamduplee, Tungmahamek, Bangkok 10120, Thailand
J. Chanwutitum
Faculty of Engineering, King Mongkut's Institute of Technology North Bangkok,
Pibulsongkram Road, Bangkok 10800, Thailand.
Abstract Faculty of Engineering and Research Center for Communication and Information Technology
King Mongkut;s Institute of Technology Ladkrabang, Ladkarabang, Bankok , Thailand
Tel: 66-2-3269967 , 66-2-3269081, Fax :66-2-3269086
E-mail : kobchai@telelan.telecom.eng.kmitl.ac.th
C. Pienvijarnpong
National Research Council of Thailand
MOS-1 Receiving Ground Station, Ladkrabang, Bangkok 10520, Thailand
C. Soonyeekan
Aeronautical Radio of Thailand
102 Ngamduplee, Tungmahamek, Bangkok 10120, Thailand
J. Chanwutitum
Faculty of Engineering, King Mongkut's Institute of Technology North Bangkok,
Pibulsongkram Road, Bangkok 10800, Thailand.
The fusion of multi-sensor and multi-resolution details of an effective exploiting the complimentary nature of different data types, especially the obtained image from multi sensor have the clearly different characteristics such as the SAR image and multi-spectral image including with the characteristics of wavelength, sensor and measuring technique. The Radar image uses the back- scattering wave technique in the antenna direction gives two dominant characteristics ; discontinuity/roughness of the object surface assign the reflected wave direction, the object absorption depending on the moisture. However, the classification and interpretation of SAR image are quite difficult with low precision according to both characteristics vary with the structure and different object type. Therefore, the dominant data addition of multi-spectral image into SAR image will make the data analysis to be comfortable and easy.
This paper proposes the mixed data of SAR and OPS ( optical sensor ) obtained form JERS-1 satellite in the flood period of central area of Thailand as study region. This region is water hole with flooding. To use the wavelet decomposition based on low wavelet coefficient of SAR image is included with OPS image, the wave absorption from the object moisture is combined with the other physical data by using the multi -layer perception ( MLP) neural network based on the back propagation ( BP) algorithm suitably for multi-spectral image . thus, the classification and analysis of flood area will be high resolution and high accuracy.
1. Introduction
There have been several efforts to monitor and assess flood area. Especial, the monsoon region were suddenly inundated by slash flood caused by the storm and others natural hazard, such as El Nino, LA Nina I and etc. this flood caused much damage to the environment, people's live and properties. Several Techniques have been applied to estimate the flood area . [1] using the NDVI ( normalized difference vegetation index derived from multi-spectral data and 3-second grid DEMs ( digital elevation models to investigate and identify the damage area depending on elevation intervals.
However, the SAR images have been known an efficiently flood detection, because of the object absorption property depending on the moisture, of the back-scattering wave in Radar image. as the multi-spectral images provide necessary information for land cover interpretation. The fusion of multi-sensor images achieves the complementary nature of theses different data types. Therefore, the fusion techniques have been adopted to perform the flood area classification. To assess the flood areas, , JERS-1 SAR data acquired on June 03, 1997 and August 30, 1997 were taken before and during flood hazard form the tropical storm Zita, in Surat Thani province, were used. Because of this cloud penetration capability and shown in Fig. 1 and 2, respectively. Fusion these images with JERS-1 OPS data acquired on March 14, 1997 war performed to distinguish flood area.
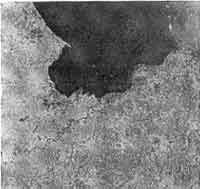
Fig. JERS -1 SAR image acquired on June 03, 1997, Surat Thani Province
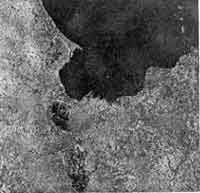
Fig 2. JERS-1 SAR image acquired on August 30, 1997.
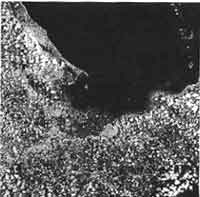
Fig 3 JERS-1 OPS data acquired on March 14, 1997.
To study the flood assessment, the image classification is used as a revolutionary computing methodology known as the artificial neural network ( ANN) computing, which has been performed. This method presents how the neuron in the human brain process the data to identify the complex and noisy patterns of infor4emation. An error back-propagation artificial neural network structure is used in this paper.
2. Image Fusion
Image fusion integrates both spatial and spectral data to hold the superior characteristics of multi-sensor images and improve the knowledge of scene. Therefore, the fused images could improve the accuracy image classification and helps the feature extraction and recognition. The image fusion can be divided into tow classes : spatial domain method and spectral domain method. The last method is used in most application, scum as color space transformation. In this paper, the I HS ( Intensity-Hue-Saturation ) model will be used as a color space and the image fusion is done as follows:
1. The RGB color space of OPS images is transformed to the I HS model [3]:
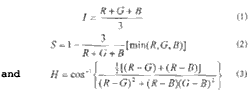
2. The different gray value of pixel in the black-white of two SAR images (g1 and g2) are added into OPS images intensity:
I' = I+ (g1-g2) (4)
The last term of the above equation is the different of before and during flood. The flood area will be emphasized and non- flood area will be depressed. Adding this term to intensity component in I HS mode means transferring of flood area data to OPS image.
3. The I HS model is inversely transformed to the RGB space and ready to classify in the further
3. Neural network classification
In this paper, the multi-layer perceptron ( MLP) neural network based on back propagation ( BP) algorithm is used as classifier, which consists of set of nodes arranged in multiple layers with connection only between node in adjacent layer by weights. The input information are presented at input layer as the input vector. And the output vector is the processed information, that were retrieved at the output layer. A schematic of a three-layer MLP model is shown in Fig 4 and using in this paper
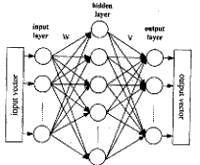
Fig .4 The 3 -layer ( MLP modle of neural network.
The input and output of the node I in hidden layer of MLP neural network, according to BP algorithm [4], are :
Where, Wij: the Weight of connection from node I to node j:
Bi : The numerical value called bias.
f ;The activation function
In this work the nonlinear function, sigmoid function given in eq. (6), is used to determine the output state:
The back-propagation ( BP) learning algorithm is designed to reduce an error between actual and desired output in a gradient descent manner. The summed squared error ( SSE) is defined as:
Where Opi and tpi are the actual and desired output of node I as applying the input vector p into the network.
4. Methodology and results.
4.1 Method
- The SAR data obtains 16 bit and are reduced to 8 bits in order to obtain 256 values of intensity by using linear scaling .
- From wavelet decomposition [5], the low wavelet coefficient of SAR images will be used within tow reasons, to remove the speckle noise and continue the proper data for applying to neural network training algorithm.
- The 12.5m x 12.5m resolution of SAR data were reduced to 25m x 25m in the same order of OPS resolution. Al images should be registered and geometric corrected.
- Data fusion technique as mentioned in section 2, is used and shown Fig.5.
- After pre-processing satellite image prepares then applying to neural network classification. Anyway, all data are also classified without fusing and all results will be compared.
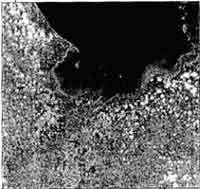
Fig. 5 Fused image for flood area assessment
4.2 Results
| Classification | Water | Cloud | Urban | Vegetation | Bare soil | |||
| Flood | Non flood | Flood | Non flood | flood | Non flood | |||
| Result/testing ( pixel ) | 447/500 | 47/50 | 41/50 | 42/50 | 44/50 | 90/100 | 41/50 | 87/100 |
| Correction % | 89.4 | 94.0 | 82.0 | 84.0 | 88.00 | 90.0 | 82.0 | 87.0 |
| Classification | Water | Cloud | Urban | Vegetation | Bare soil | |||
| Flood | Non flood | Flood | Non flood | flood | Non flood | |||
| Result/testing ( pixel ) | 457/500 | 45/50 | 38/50 | 40/50 | 41/50 | 92/100 | 37/50 | 89/100 |
| Correction % | 91.4 | 90.0 | 76.0 | 80.4 | 82.0 | 92.0 | 78.0 | 89.0 |
5. Conclusion
The study result show that multi-temporal SAR data which are very useful for flood assessment and monitoring. While, the OPS data provide the necessary information for land cover interpretation. The fusion of theses data is very helpful for flood assessment classification, because it enhances the flood area and gives the highly reliable result.
Acknowledgement
The ground truth information are kindly supported by office of Agricultural Economics, Ministry of Agriculture, Royal Thai Government.
6. References
- C. Kim and K.H. Chi, " Flood Damage Mapping in North Korea Using Multi-Sensor Data , " Proc . 19th Asian Conference on Remote sensing, pp . C-1-1-C-1-6, Nov. 16-19, 1998
- Y.C. Liao, T.Y. Wang and W.T. Zheng, " Combining The Spectral and Spatial Signatures of Information Classes Using Artificial Neural Network Based Classifier for Remote Sensing of Spatially Heterogeneous Land-Use/land Cover System in the Tropics, " Proc. 19th Asian Conference on Remote Sensing, pp I-2-1-I-2-7, Nov. 19-19, 1998.
- J. Nunez, X. Otazu and R. Ardiol, " Multiresoluiton Based Image Fusion with Additive Wavelet Decomposition, " IEEE Trans. Geoscience and Remote Sensing. Vol 37. No.3, pp . 1204-1211, May 1999
- National Space Development Agency of Japan ( NASDA), JERS SAR/ERS AMI image Data Format Manula, 1996.
- Y.H. Pao, Adaptive Pattern Recognition and Neural Network, Addison-Wesley Publishing Company, Inc., 1989.