| GISdevelopment.net ---> AARS ---> ACRS 1999 ---> Poster Session 6 |
Remote Sensing Aerosol
Optical Depth from Space and Ground
Zhang Junhua Mao Jietai
Dept. of Geophysics, LSSR1 Peking University
AbstractDept. of Geophysics, LSSR1 Peking University
Atmospheric correction is an important part of the data processes for the satellite remote sensing. The optical depth of atmospheric aerosol is an important parameter for this correction. The main aim of the project "The Radiation Characteristics of the Atmospheric Aerosols over China Area" was to deduce the data of aerosol optical depth over all the China. On the ground, five Sun-photometers are used to measure the optical depth from Feb. 1998 to Jan. 1999 in five sites. The Sun-photometer has ten wavebands between 0.4 to 1.0 micrometer, it gives the wavelength dependence of optical depth. This information is used to deduce the size distribution of the atmospheric aerosols. The satellite data include the visible channel of GMS-5 and TOMS are used in this project. Combining with the Sun-photometer data observed at HeFei, the GMS-5's data is used to retrieve the optical depth and the water surface reflectivity over the Chao Lake. The result shows the biggest relative error of the month average optical depth can be controlled fewer than 30%.
1. Introduction
Atmospheric aerosol is an important parameter in atmospheric correction for remote sensing and in research for climate changing. It is also one of the most uncertain parameters for these study. Many measurements have been done in recent years over the world to obtain the detailed information of the aerosol spatial distribution and variation with time. The methods include direct measurement by particle counter (G. Shi et al., 1995) and remote sensing from Sun-photometer and satellite (M. Stettler et al., 1993; R. B. Husar et al., 1997).
For getting the information of atmospheric aerosol in China, the project "The Radiation Characteristics of the Atmospheric Aerosols over China Area" was put into practice. In this project five Sun-photometer were used to measure the Aerosol Optical Depth (AOD) from ground in 1998. These five sites are Shang dian Zi of Beijing (40.65° N, 117.12° E), Wa Li Guan of Qing Hai (36.29° N, 100.90° E), Xing Feng Jiang of Guang Dong (24.05° N, 114.2° E), He Fei of an Hui(31.31° N, 117.16° E) and Dang Xiong of Tibet (30.48° N, 91.1° E). The satellite data of the visible channel of GMS-5 and TOMS are also used in this project to retrieve the AOD all over China.
In this paper, we first discuss the Sun-photometer remote sensing data of AOD, then discuss the method to retrieve the size distribution from these AOD data, in the end we will show the results of AOD retrieved by GMS-5 and TOMS.
II. Ground-Based Remote Sensing
The Sun-photometer we used in this project have ten bands from 400nm to 1000nm. The bandwidth is 10-20nm. All of them are calibrated in Xing Long observatory (HeBei provinces) using Langley method. The linear correlation of the Largley plots are greater than 0.99, some of them greater than 0.999.
2. Data of AOD
After the extinction of the aerosol was measured by the Sun-photometer. The data of AOD were computed using calibrated constants. The results of 550nm AOD are shown in Figure 1 to Figure 5. Because it is difficult to observe in Tibet, we only have the data from late May to early July in Dang Xiong region.
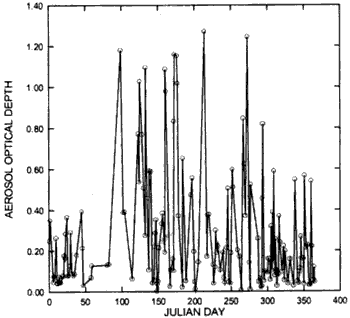
Figure 1: AOD variety over the year in the area of shang Dian Zi
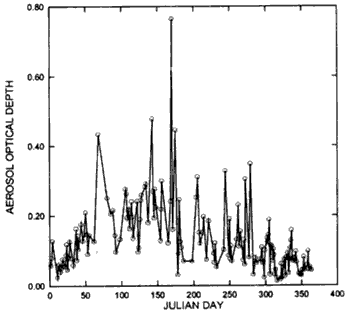
Figure 2: AOD variety over the year in the area of Wa Li Guan
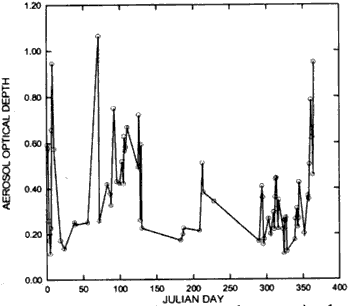
Figure 3: AOD variety over the year in the area of Xin Feng Jiang
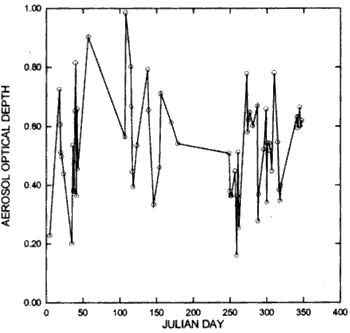
Figure 4: AOD variety over the year in the area of He Fei
Figure 1 to Figure 4 show that the value of AOD has an obvious dependence on the season. Normally spring has the highest value of AOD. This phenomenon is associated with the dry climate in spring. In this season, wind brings more dust to atmosphere from ground. In Tibet, the climate can be distinguished by dry and wet season. Although we only observed no more that two months in the area of Dang Xiong, it includes these two seasons. The wet season begins from about 160 Julian day. As can be seen from Figure 5, the value of AOD in dry season is higher and has larger day to day variation than wet season. Many areas over the world also show the AOD dependence on climate such as R. T. Pinker et al (1997).
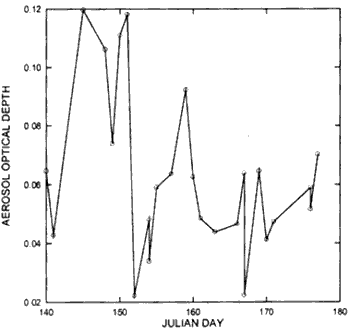
Figure 5: AOD variety over the period of observation in the area of Dang Xiong
3. Retrieval of the Aerosol Size Distribution
The optical properties of aerosol are determined by the aerosol size distribution, refractive index, shape of the particle etc. it is very difficult to retrieve all these parameters from the data of AOD. But we can assume that the atmospheric aerosol is composed of four types of aerosols as recommended by WCP-55 (1983). They are dust like, water soluble, oceanic and soot. The parameters of these four types are assumed well known, and their size distribution accords to Log-normal function. Ten the AOD of k(k=1,10)band can be calculated by the formula:

where ni means total number of particles of i(i=1, 4) type, fi(r) means size distribution of i types.
According our assumption, we know well the parameters of the four types of aerosol, so we can use MIE theory to calculate QEX(). Then in formula (1) only n is unknown. Because we have known the AOD of ten bands, we can have ten formulas with only four unknowns. It is enough to retrieve the total number of particles of each type. The size distribution of the aerosol can be obtained by adding these four types together.
III. Satellite Remote Sensing
When illuminated by the Sun, aerosol particles can scatter a fraction of the solar radiation back to space. The radiation received by satellite includes the information of aerosol. So satellite can be used to retrieve aerosol distribution. As we can see, although ground based remote sensing can get the aerosol properties, it is a hand work to set enough ground-based equipment to get the aerosol properties over the world, especially over ocean, desert and other hard environment. Satellite have a high spatial and temporal resolution, it is widely used to map aerosol distribution, especially over ocean (Y. J. Kaufman, 1997; T. Nakajika, 1997).
The main aim of the project "the radiation Characteristics of the atmospheric Aerosols over China area" was to deduce the data of atmospheric optical depth over all the China. So besides using Sun-photometer in five sites as discussed above, we will retrieve the data of AOD by GMS-5 and TOMS data.
1. GMS-5 Remote Sensing
Assuming the Earth's surface is Lambertian surface with a reflectance Rs, the measured reflectance of the visible channel can be expressed as

where TA(m0) and TA(m) stand for the total transmittance of the atmospheric from the Sun to the surface and from the surface to the instrument, respectively. RA is the atmospheric reflectance. The factor 1/(1-Rs RA) expresses the multiple reflections between the surface and the atmosphere.
We can see from equation (2), RM is related to the reflectance of the surface and the components of atmosphere. For one channel retrieval, we must know one of them to retrieve another. Water surface has low and relative steady reflectance in visible channel. It is more convenient to retrieve the AOD over water than over land (Y. J. Kaufman, 1997). So we want to retrieve the AOD data over twenty-five lakes first. Chaoi Lake is one of the lakes.
We have the AOD data of He Fei observed by Sun-photometer, a site not far from Chao lake. First, using the data of AOD as atmospheric correction, the reflectance of the lake is retrieved. The result is shown in Figure 6. Then assuming the reflection of the lake is known, the AOD over the lake can be retrieved by satellite measured reflectance. The comparison between the month averaged AOD (550nm) observed by Sun-photometer and retrieved from satellite reflectance is shown in Figure 7.
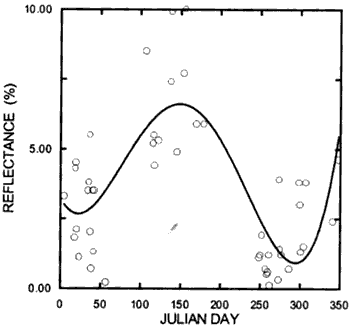
Figure 6: Reflectance of Chao lake over the year ovserved by GMS-5 visible channel
Figure 6 shows the reflectance of the lake change with the season. Late spring has a peak of the year. The reason is the wavelength range of GMS-5 visible channel is 0.5mm-0.9mm. High reflectance of chlorophyll in near infrared makes the lake have a high surface reflectance. As can be seen from Figure 7, the biggest relative error between the months averaged AOD retrieved by GMS-5 and observed by Sun-photometer is no more than 30%.
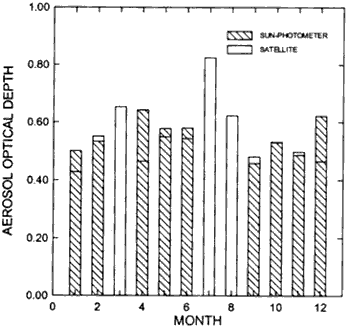
Figure 7: Comparison of AOD observed from Sun-photometer GMS-5
2. TOMS Remote sensing
Because of the requirement of low and nonvariable surface reflectance, the method of using satellite visible channel to retrieve AOD is limited to being over water. In UV band, the surface reflectance is low and nearly constant over both water and land. So in recent years some authors have tried to detect aerosol using TOMS data (J. R. Herman et al., 1997).
Mostly these works use a spectral contrast method. The term used in this method is called Aerosol Index (AI). For Earth Probe (EP) TOMS, AI can be expressed as

where Imeas is the backscatter radiance measured by TOMS at a given wavelength, Icalc. Is the radiance calculated using a Radiative transfer model for a pure rayleigh atmosphere.
This method is suitable for absorb aerosol layer in a high latitude (more than 2 km), in this case subpixel clouds problem can be minimized. AI has a good relationship with AOD of the high latitude absorb aerosol, such as biomass burning smoke and mineral dust from desert (N. C. Hsu et al., 1999). In the normal case, the layer of aerosol is near the ground. This method is not suitable. In our study, first we choose no cloud condition method to retrieve AOD from TOMS data. Figure 8 is relationship between AOD (450nm) of Shang Dian Zi and AI of TOMS. Figure 9 is relationship between AOD (450nm) of Shang Dian Zi and reflectance (360nm) of TOMS.
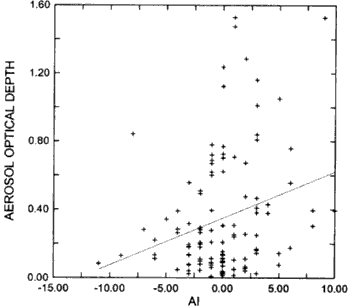
Figure 8: Relationship between AOD and AI of TOMS
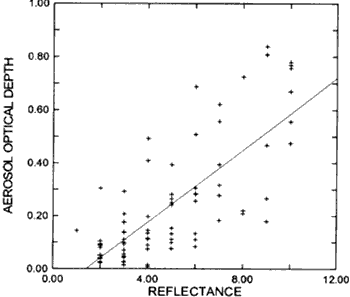
Figure 9: Relationship between AOD and reflectance of TOMS 360nm band
We can see that AOD has acceptable good relationship with reflectance of TOSM, the correlation coefficient is 0.75.
IV. Conclusion
We have discussed three different methods for AOD remote sensing. During these methods, remote sensing using Sun-photometer is well developed, it has enough accuracy and can be used to validate other methods. The results of Sun-photometer remote sensing show that the value of AOD is associated with the site, climate, environment etc. So it is possible to estimate the value of AOD in a certain area by a source model.
The results also indicate that the visible channel of GMS-5 can be used to retrieve the value of AOD over lakes. It has a satisfactory accuracy. As land and water have low and constant reflectance in the 360nm band of TOMS, retrieval of AOD from TOMS data is a potential method for aerosol remote sensing, especially over land.
References
- J.R. Herman et al., 1997, Global distribution of UV-absorbing aerosol from Nimbus 7/TOMS data, J. G. R., Vol. 102 No. D14, 16911-16922
- M. Stettler and W.von Hoyningen-huene, 1993, estimation of Pinatubo aerosol size distribution and its influence on spectral optical thickness measurements in Canada, Beitr. Phys. Atmosph. Vol. 66, No. 4, 347-354.
- N.C. Hsu et al., 1999, comparisons of the TOMS aerosol index with Sun-photometer aerosol optical thickness: Results and applications, J.G.R., VOL. 104, NO.D6, 6269-6279.
- R.T. Pinker et al., 1997, Aerosol optical depths in a semiarid region, Journal of Geophysical research, Vol. 102, No. D10, 11123-11137.
- Rudolf B. Husar et al., 1997, Characterization of tropospheric aerosols over the ocean with the NOAA advanced very high resolution radiometer optical thickness operational product, J. G. R., VOL. 102, NO. D14, 16889-16909.
- Teruyuki Nakajima et al., 1997, AVHRR remote sensing of aerosol optical properties in the Persian Gulf region, summer 1991, Journal of Geophysical research, Vol.102, No. D14, 16935-16946.
- Y. J. Kaufman et al., 1997, Passive remote sensing of troposhpeic aerosol and atmospheric correction for the aerosol effect, J. G., VOL. 102, NO. D14, 16815-16830.
- XiuJi Zhou, 1996, The Variety of Ozone in the Area of China and its Effect on Climate, (-__), Beijing: China Meteorology Press, 202-208pp.