| GISdevelopment.net ---> AARS ---> ACRS 1999 ---> Poster Session 6 |
Study on Remote Sensing
Method of Classifing High Medium and Low Yield Far-Mlands and Their
Formation Factors in Loess Area Take a Example of Dingxiang Cou-nty,
Shanxi pravince
Qiao Yuliang , Feng
Jiuliang , Zhang Guorong
Agricultural Comprehensive Development Bureau of shanxi province, china
Abstract
Agricultural Comprehensive Development Bureau of shanxi province, china
This is an introduction to the method of classifying high medium and law yield farmlands by remote sensing and GIS, which is the result of a key project of the Scientific and Industry Technology committee of National Defense. In the study, special information related to high medium and law yield farmland was compounded with TM data. The development of the method of compound hierarchy classification improved accuracy of remote sensing classification greatly.
1. Introduction
Conventional remote sensing classification methods by computer auto interpret are supervised classification and unsupervised classification, including maximum likelihood classification minim distance classification and multi-group distinguish classification Although these methods are valued and can be used to distinguish common object, they have obvious weaknesses. Many mistakes and loses may be made in conventional computer auto interpret. These are because of complexities of interpret objects: same spectra date, for different object, same object for different spectra date. In conventional methods, computer auto classification relies only spectra date of remote sensing, much important space and geographic information as well as their relationships are neglected. A lot of knowledge of geographic experts can not be used in conventional methods. We know that they are very important for farmland classification.
Along with the develop0emnt of Geographic Information System (GIS) technology, geographic information play an important role in overcoming same spectra for different object to improve results of classification . In this study, considering multi factors and complexity of high middle and low yield farmland in the loess region, on the basis of statistic interpret, classification method of composite hierarchy were used. Multiple remote sensing and non-remote sensing information related to farmland yield, such as landform, elevation, soil salinity and irrigation water supply were composted with Landsat TM data. Visual interpreter's scientific knowledge was introduction Experts' though and ability of logical analysis were used to judge every map spot finally.
2. Analysis of Formation Factors of High Medium and Low Yield Farmland and Their Classification Method
2.1 Analysis of Formation Factor of High medium and low yield lands
Study area of this project was Dingxiang county, which is located in the north part of Shanxi province with total land area of 865 km2. Mountains surround the country in the east, north and couth. Alluvial and floods plains are located in the west . According to formation factors, the main types of medium and low yield farmlands are as follow:
- Drought, the county is belong to the semiarid with an annual precipitation of 400 programme, which is not enough for crop growth. Irrigation or dry, and water supply play important roles to crop yields.
- Soil salinity, soil containing much salinity which limits crop growth, mostly located in low plain.
- Water loss and soil erosion, mountains and hills cover 55% of the total land of the Dixining county, water loss and soil erosion are main limits to crop yields in mountains and hills.
High- medium- low- yield farmland on remotely sensed images is based on using computer for distinguishing by auto model discriminate technology . Geographic information system has an important role in over-coming same spectra for different target, to improve result of classification.
3. Realization of High Medium and Low Yield Farmland Classification
3.1 sampling in training areas and Initial Classification
3.1.1 Selection of information source
Landsat TM data of August 12,1987 and August 26,1994, and 340 pieces of color infrared aerial photographs (23cm*23cm) of September 8, 1987 with a scale of 1:19000 scale were used. 160 pieces of photographs were scanned.
3.1.2 Materials
Materials such as maps of land use, soil survey, hydro geology and water conservation were collected. Data on natural environmental characters and social economical circum-stances were collected. The landform maps of Xinding Basin area at scale of 1:100000 and of Dingxiang county at 1:50000.
3.2 Classification System of High Medium and Low Yield Farmlands
High yield farmlands:300kg/mu and more (wheat)
Medium yield farmlands:150-300kg/mu(wheat)
Low yield farmlands:150kg/and lower(wheat)
3.3 collection and Introduction of Special Introduction
A. Introduction sources incluce:7 band TMCCT data and images of Aug.12,1989 and Aug.26,1994, 340 pieces of color infrared air photographs of Sep. 8,1987 and 1:50000 land use map Dingxiagn county. A set of 30 agricultural special maps for Dingxiag county, color infrared air photograph and field investigation provide with hierarchical inquiry of agricultural information.
3.3.1 Irrigation:
Irrigation land with full water supply, high yield farmland
Irrigated land with full water supply (one watering / year), medium yield farmland
Irrigation system but No water supply, low yield farmland
3.3.2 Soil salinity
Non saline soil, 0.1% and lower
Light saline soil, 0.2-0.4%
Medium saline soil, 0.4-0.6%
Severe saline soil,0.6-0.8%,low yield farmland
Salinity soil, more than 0.8% low yield farmland
3.3.3 Slope: four types of hill farmland are recognized based on slope :
0.60 : plan
60-150 degree: gentle steep
150-250 degree : steep, low yield farmland
and >250 : very steep, low yield farmland
3.4 Method of compound Hierarchical classification
In the practical operation, firstly, according to landform characters of Dingxing county sub-regions were divided before classification to special factor of irrigation, slope and soil salinity.
Secondly, composting TM image with the sub- region map, a color image sub-region was got. Six sub regions were divided. In this way class numbers for every sub-region were much less than the whole region map. The phenomenon of same spectra for different object for different spectra was decreased.
Because numbers of classes were decreased and area of sub-region was reduced, time used for computer classification was cut down greatly. It is benefit to computer training of sample area and modification of the classification results. Flowchart of classification is as follows. this method integrated remote scenting information for interpreting high middle and low yields farmlands with non-remote sensing information which effect on yield. ?The factors of irrigation, soil salinity and slope were analyzed comprehensively. Classes tend to simple because of sub region divided. As a result, accuracy of classification was increased greatly.
In this study, Landsat TM data were the main information source, corroborated with color infrared aerial photographs and field inspection. A farmland monitoring system was established, which is supported by RS, GIS and multi-media technology.
Considering multi-factors and complexity in classification of high-medium-low yield farmland, composite hierarchical classification with multiple information sources, assisted by GIS and based on statistical decision was used. The non-remote sensing factors, such as topography, elevation ,irrigation soil salinization etc, were selected to complex with TM data image. Image were interpreted by comprehensive analysis and compared with all kinds of scientific knowledge and ability of visual interpreters. Actually, at first the regions were divided followed classification of the lastly images, at last composite hierarchical divisions were combined.
Thus, the maps of the sub-region for high-medium-low-yield farmland in Dingxiang county were made according to topographic characters, irrigation, soil salty and soil slope. Six sun-regions divided
Sub-division resulted in less number of crop types in each sub-region. Interpretation errors resulting from same targets with different spectra or different targets with same spectra con be overcome. Flowchart of classification is as follows:
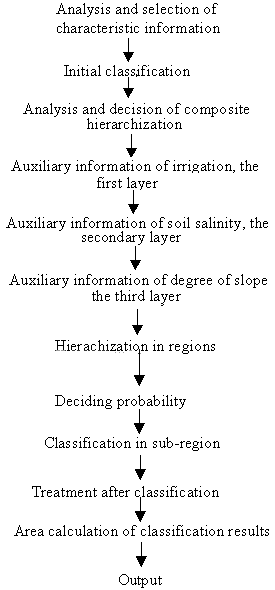
Flowchart of classification of composite hierarchy
In the final stage, combining the classification result of six sub-regions, the classification map of high-medium-low yield farmland of Dingxiang county was made. Accuracy of classification was increased greatly by using GIS.
4. Evaluation and Acuracy Analysis of Achivement Results
4.1 Evaluation of monitoring results
It took two years to finish the work. The results include division maps of nigh medium-low-yield farmland for shanxi province on the 1:500000 scale; the distribution maps of high-medium-low-yield farmland on the 1:100000 scale for Xinding Basin; the classification maps of high-medium-low-yield farmland on the 1:50000 scale and remote sensing monitoring of dynamic variation in Dingxiang county.
The monitoring results showed that a great change in cultivated area occurred between 1989 and 1994 in Dingxiang county (Table1). There was an increase of 1182 ha. High yield, but a decrease 1449 ha. Of medium- low yield land, resulting in a decrease of the total cultivated area by 267 ha. This means that medium-low-yield land in Dingxiang county.
| year | high yield | Medium yield | low yield | Total area |
| 1989 | 9680 | 12468 | 14911 | 37059 |
| 1994 | 10862 | 11743 | 14187 | 36792 |
| variation | +1182 | -725 | -724 | -267 |
The result show that saline soil was improved in plain area (Table2)
| Year | Light | Medium Saline Soil | Servere Saline Soil | Saline Wadte land | Total area |
| 1989 | 3601 | 3471 | 3100 | 1548 | 11720 |
| 1994 | 2973 | 3100 | 2840 | 1493 | 10406 |
| Difference | 628 | 371 | 260 | 55 | 1314 |
The monitoring result shows that a great change has happened in structure of farmland of Dingxing county during the last f5 years Much of medium-low yield land was changed into high yield land due to soil amelioration. There was reduction in to9tal cultivated land.
4.2 Analysis of accuracy
At the final stage of the4 project, 5% of mapping spots of monitoring high-medium-low-yield land were selected and studied in the field. The error spots are only 4.7%. In addition, 60% color infrared air-photos were taken for analysis and comparison with monitoring results, and the error was found to be only 4.9%. In addition, using sampling method based on stoical approach, 13875 sampling spots in Landsat TM image were interpreted and compared with the results of computer classification. The results are given in Table3.
| Items | high Yield Land | medium Yield Land | low-yield Land | Total cultivated area |
| Classification on sampling difference % | 10863 | 11743 | 14187 | 36793 |
| 10791 | 12367 | 13551 | 36709 | |
| -72 | 624 | -63 | -84 | |
| -0.6 | 5.3 | -4.5 | -0.2 |
Table 3 shows that maximum error of 5.3% was recorded for medium-yield farmland and for the total cultivated area, it was only 0.2%. According to farmland investigation checking of satellite image with air photos and sampling satellite image, improves the total accuracy of monitoring result to 95%.
4. Conclusion
In this study, the methods of composite hierarchical classification of high-medium-low-yield land was developed. It can also be extended and applied to other region. The accuracy of farmland monitoring in high-medium-low-yield reaches as high as 95% using remote sensing, GIS and multi-media technoloty. A remote sensing system for farmland monitoring was developed. Now, as agricultural comprehensive development become a main task in the nation and every provinces, This study provides an effective methods to monitoring farmland by remote sensing for comprehensive agricultural development planning. It will play an important role in comprehensive panning of agricultural development to promote land use efficiency and increase economic and social benefits.
Reference
- Pen Wanglu, computer Treatment of Remote Sensing Data and Geography Information System, Beijing Teachers University Publishing House, 1991
- Qiao yuliang Study on land use dynamic remote sensing in water loss and soil erosion area, Environment Remote Sensing, No.3,1992
- Quia Yuliang, Application of color infrared aerial photos in water-irrigated farmland in Xinding basin and saline soil dynamic monitoring. The National Land Source Remote Sensing, No.2, 1993.