| GISdevelopment.net ---> AARS ---> ACRS 1999 ---> Poster Session 6 |
The Potential of
Multiparamenters SAR Data in forest Application of China
Liao Jingjuan, Gao Huadong,
Shao Yun
Laboratory of Remote Sensing Information Sciences,
Chinese Academy of Sciences,
P.O. Box 9718, Beijing 100101, China
Abstract Laboratory of Remote Sensing Information Sciences,
Chinese Academy of Sciences,
P.O. Box 9718, Beijing 100101, China
This paper presents the results of forest discrimination, classification, and volume estimation in two test sites of China using multiparmeters airborne and spaceborne imaging radar data. The SAR data are acquired during SIR-C/X-SAR and GlobeSAR missions. To improve the understanding of radar backscatter to canopy geometric feature, we extracted backscatter coefficient and intensity to analyze the effect of forest type discrimination, and the relationship between forest parameters and radar backscatter. This study shows that it is very efficient and intensity to analyze the effect of forest type discrimination, and the relationship between forest parameters and radar backscatter. This study shows that it is very efficient for multifrequency and multipolarization SAR data to discriminate different types of forest.The intensity of radar backscatter is also quite sensitive to the forest parameters, especially diameter at breast height (dbh) and tree mean height. Based on this sensitivity, the forest volume of the test site was mapped into five classes.
Introduction
Remote Sensing for forest monitoring is important for understanding phenomena such as the global carbon cycle, hydrologic cycle, and energy balance. Many environmental problems of increasing importance are related to forest extension and condition. In 1983 NASA estimated that forest cover 33% of the total land surface, contain 90% of the standing biomass, and yield 65% of the net primary production. An increase in both global population growth and deforestation around the world requires accurate and timely information about the distribution and rate of change of global vegetation. This information has traditionally been derived from a variety of sources, the accuracy of which is difficult to ascertain. Remote sensing is a potential method for gathering this information, as has been demonstrated from AVHRR data. However, pervasive fog and cloud as well as limitations in solar illumination in the tropics and subtropics and high latitudes severely limit the utility of visible and infrared sensors. Synthetic aperture radar (SAR), with its near all weather, day and night capabilities, is a powerful tool for acquiring biophysical data that will improve understanding of global climate, the hydrologic cycle, the carbon-nitrogen cycle, and the global energy balance.
Many airborne and spaceborne SAR system have been used to carry out a large amount of experiments for investigating the forest ecosystems. The airborne systems, such as the NASA/JPL AIRSAR system, operating at P,L and C band, has flown over many forest sites inUSA and Europe (Zebker et al., 1991; Le Toan et al, 1992; Beaudoin et al., 1994; Rignot et al.; 1994; Skriver et al., 1994; Ranson et al., 1996). The experiments of the Canadian CV-580, as well as the European airborne system, mainly operating at C and X band also have been carried out in North America and Europe (Drieman et al., 1989; Hoekman, 1990). The spaceborne systems, such as the Seasat SAR, SIR-B, SIR-C/X-SAR and ERS-1, SAR, etc., were used for investigations of boreal, temperature and sub-tropical forestry test sites (Ford et al., 1988; Dobson et al., 1992; Ranson et al., 1995; Stofan et al., 1995; Rignotet al., 1995). These experiments and studies have shown that radar is sensitive to forest structureal parameters including above-ground biomass (Dobson et al., 1992; Pulliainen et al., 1994; Skriver et al., 1994; Ferrazzoli et al., 1995; Ranson et al., 1996). The study has demonstrated the use of SAR data to retrieve forest mapping and monitoring. Some models have been proposed for understanding and interpreting the electromagnetic interaction effects producing this sensitivity (Durden et al., 1989; Richards et al., 1990; Ulably et al., 1990; Sun et al;, 1991; Chauhan et al., 1991; Wang et al., 1993). So it is available for carrying out forest monitoring and developing the algorithms to estimate forest parameters based on the models and the sensitivity.
In this paper, we firstly describe briefly the test sites and data resources. The methodologyand result of forest discrimination and parameter estimation are then presented. The relationship between radar backscatter features and forest parameters are studied and the effect of SAR data on forest type discrimination are also discussed based on the extraction of radar backscatter coefficients.
Test Site and Data Sources
The distribution of forest has large difference in the northern and southern China due to its vast territory. Hence we selected two test sites in the south and north to explore the forest applications. A test site for three north shelter forests was selected west of Yichuan country, Shanxi Province, with the Yellow River flowing south on the eastern side of the image. This site has an average elevation of 1300 to 1400m, with hilly landforms of loess characterized by gullies and ravines due to surface erosion. It is a temperature, dry to semi-dry region with little annual rainfall. The forest in the site is part of three north shelter forests in China. Forest types are mainly deciduous, coniferous, and mixed forest. Deciduous trees are mainly popular and oak, coniferous trees are pine stands, and mixed forest are composed of deciduous mixed forests are composed of deciduous mixed forest and coniferous-deciduous forest. Another test site is Zhaoqing area, which is located in Guangdong Province of South China. It is a topic to subtropic regions, has heavy precipitation and moist climate, where soil moisture contents may vary widely within a short period. Soils consist of clay and silt, and have medium roughness. The ground surface has less vegetation cover because pine stands are artificial regeneration. Topgraphically, the region varies from flat to gently rolling, with a maximum elevation changes of less than 100m, and an average slope of 15 degree. The forest study is concentrated in the northeast of the test site. This area mainly consists of forest lands, agricultural fields, orchards, and water bodied, and with an area of more than 600 hectare. The forest stands are predominately coniferous(>60%), while deciduous and mixed trees are few in numbers (Liao et al., 1996). Pine dominated coniferous forests are plantation stands with average age of 10-15 years so that they are all young and have a crown closure of less than 20%. The height of pine trees usually ranges from 2 to 4 m with the tallest reaching 6.5 m. The density of the trees is from 850 to 5500 trees per hectare. The pine trees have 5-8cm diameter at breast height (dbh).
The Shuttle Imaging Radar-C/X-band SAR)SIR-C/X-SAR) and GlobeSARdata are used in the study. They were acquired in April 1994 and November 1993. Table 1 shows their system parameters. For the GlobeSAR data, we performed antenna pattern correction for the data to remove the artificial for the data to remove the artificial brightening in range due to side looking illumination. The digital elevation model (DEM) generated by digitzing a 1:50,000 topographical map was used for geometric correction of the data and to reduce
The terrain effect. Combining C and x band with HH, HV and VV polarization SAR data produced the false color image. Filter and image enhancement techniques were used to improve the quality of image. For the SIR-C/X-SAR data, we did geometric rectification and speckle filtering prior to generating the false color composite images.
| System Parameter | SIR-C/X-SAR | GlobeSAR |
| Wavelength (cm) | L(23.5),C(5.8), X (3.1) | C(5.66),X(3.24) |
| Plarization | HH,HV,VH,VV | HH, HV, VH, VV |
| Azimuth | 25x 25 | 6 x 6 |
| Resolution(m) Range | 13x26 | 6 x 6 |
| Resolution(m) Imaging swath (km) | 15~90L and C), 15~60(X) | 22 |
| Pixel space (m) | 12.5 x 12.5 | 6 x6 |
| Look angle(°) | 20~55 | |
| Flight altitude | 225km | 5400m |
| Platform | Shuttle | Airplane |
Effect of Multiparamters SAR on Forest Type Discrimination and Classification
The SIR-C/X-SAR data were used to study the effect of forest type discrimination and classification. In the test site for three north shelter forest, the false color frequency-polarization combinations of L-HH, L-HV, C-HH, CH-HV, and X-VV were generated. In the false color composite image of L-HV (Blue), coniferous forest appears as yellow, mixed forest as red and white, and deciduous forest as blue; therefore three forest types can easily be discriminated by using color (Figure 1,2).
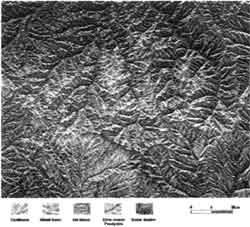
Figure 1. Multifrequency and multipolarization false color SIR -C/X-SAR image of three north shelter forests in the Yichuan area, Shanxi Province.
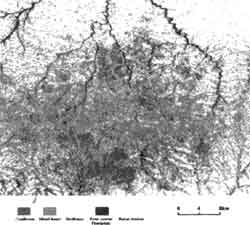
Figure 2. Classification map of three north shelter forests in the Yichuan area, in the Yichuan area, Shanixi Province based on multifrequency and multipolarization SIR-C/X-SAR data.
Five to seven training areas were selected from the image based on the 1:500,000 "Forest Distribution Map in Loess Plateau Area of China". A supervised classification, maximum likelihood method was employed using L and C bands, HH and HV polarization. Coniferous, deciduous, and mixed forest, river course plain or floodplain, and radar shadow can be discriminated on the image. The accuracy of classification results was analyzed, and the results showed that coniferous forest had the best classification accuracy at 79.7%, mixed forest had an accuracy of 68%, and deciduous forest had an accuracy of 60.2%. The average classification accuracy was 75.10%, and the overall accuracy was 70.4%. Therefore, the SIR-C/X-SR data were quite successful for discrimination of three north shelter forest types.
The radar backscatter coefficient can demonstrate the interactive relationship between radar beam and ground targets. In the study, it was used to analyze and discuss the effect of multiparameters SAR data in forest discriminiation and classification. We extracted the backscatter coefficient (Table 2) of the different frequency and plarization SIR-C/X SAR data using the calibrated results (Freeman et al., 1995). For the single band and single polarization data, the backscatter coefficient values of coniferous, deciduous and mixed forest is very similar. It suggests that is very difficult to identify and separate these three types of forest in the single band and single polarization image.
| Forest Type | Coniferous | Deciduous | Mixed forest |
| L-HH | -4.68 | -5.75 | -4.58 |
| L-HV | -7.28 | -7.96 | -7.62 |
| C-HH | -4.67 | -4.86 | -3.56 |
| C-HV | -6.50 | -6.19 | -5.84 |
| X-VV | -3.64 | -3.37 | -3.46 |
When the wavelength is difficult, the backscatter coefficient values of same polarization of these three types of forest have no much variable, such as -3.65~5.75dB for L-HH and C-HH, -5.84~7.96dB for L-HV and C-HV, and -3.37~-3.64dB for X-VV. However at the different polarization, the values of same frequency have large change. The result shows that it is more efficient for polarization than wavelength to discriminate the forest type. This reason is that the wavelength mainly determines that the radar penetrates the ability of forest canopy, and the polarization mainly delineates geometric features of canopy, so it is available for different types of forest discrimination. So the forest types can be efficiently discriminated with the combination of multifrequency and multipolarization SAR data.
Forest Volume Estimation Based Relating Radar Backscatter to Forest Stand Parameters
It is important to study the relationship between radar backscatter and forest parameters. It may improve understanding of the relationship between radar backscatter and phonological variables, and improve radar backscatter models of tree canopy properties, and develop a radar-based scheme for monitoring forest phonological changes.
The GlobeSAR data were uncalibrated. We utilized the radar backscatter intensity instead of the radar backscatter coefficient. To compute the mean of SAR data for a stand, the stand on the SAR imagery was located, and the largest possible window within the stand was extracted. For each stand, at least 200 image pixels were averaged. In the study, the mean values of radar vackscatter intensity from C and x bands, HH and VV polarizations were extracted.
Correction between the SAR data and forest stand parameters has been analyzed. The correlation coefficients between the SAR data and the forest stand parameters are shown in Table 3. The forest stand parameters are shown in Table 3. The forest stand parameters consist of stand basal area, density, mean height and dbh. It can be seen that the correlation coefficients are larger in the mean stand height and dbh than in the stand basal area and density. As the mean dbh and height of trees in the stands increase, the C-HH, C-VV, X-HH and X-VV backscatter increase. However, there is almost no relationship between the radar backscatter and the stand density, and the backscatter from the C-HH, C-VV, X-HH and X-VV also show almost no trend as the stand basal areas vary.
| Basal Area | Stand density | Tree Height | dbh | |
| C-HH | 0.29 | -0.44 | 0.93 | 0.93 |
| C-VV | 0.09 | -0.42 | 0.90 | 0.91 |
| X-HH | 0.70 | -0.49 | 0.97 | 0.97 |
| X-VV | 0.53 | -0.29 | 0.87 | 0.87 |
Based on this sensitivity of radar to forest parameters, we extracted the radar backscatter intensity from GlobeSAR data of the C and X bands for both HH VV polarizations from the Zhaoqing test site, site, where ground inventories had been conducted. A multiple linear regression fit was then performed to derive an expression relating to the natural logarithm of the forest volume. The regression is of the form
where a0, a1, a2, a3, a4 are the regression coefficients; y and x are forest and backscatter intensity, respectively; and x1,x2,x3, and x4 denote the radar backscatter intensity values at C-HH, C-VV, X-HH and X-VV channels. The regression coefficients were computed to obtain: a0=-0.6589, a1=-0.13, a2=-0.66, a3 =1.20, and a4=0.59. The regression algorithm was used to estimate the pine forest volume within the 600 hectare area of the study site.
Predicted forest volume levels from the radar data were compared to the actual volume levels. We selected three sub-areas to compute the errors between the predicted and the actual volumes expressed in percent of actual volume. For these sub-areas, the errors in the predicted volume are 15.4%, 2.9% and 10.3%. These errors are very low and are comparable to the precision of the surface estimates. So we can divide the forest volume in the test site into five levels. Each percent of the levels is shown in Table 4. In the test site, the dominated forest is the pine stand with the volume of 10-30m3/ha, then 30-60m3/ha. The high volume is very few, and the pine forest is mainly from young to middle. These results demonstrate the potential of multi frequency and multipolarization SAR data for estimating forest volume.
| Volume Level (m3/ha) | Area (ha) | Percent (%) |
| <10 | 134.7 | 22.1 |
| 10-30 | 273.9 | 45.0 |
| 30-60 | 189.3 | 31.1 |
| 60-90 | 5.4 | 0.9 |
| >90 | 5.5 | 0.9 |
Conclusions
In the test site for three north shelter forests in the northern China, three types of forest, coniferous, deciduous and mixed forest, can be obviously discriminated using multifrequency and multipolarization SIR-C/X-SAR image. By the analysis of the backscatter feature of forest, it further shows it is very efficient for polarization to discriminate different types of forest.
In Zhaoqing test site of South China, the backscatter intensity from GlobeSAR data is very sensitive to the forest parameters. Based on this sensitive to the forest parameters. Based on this sensitivity, the forest volume of the test site was estimated for five classes, and the predicted error is very low and is comparable to the precision of the surface estimates.
These studies demonstrate that the multiparameter SAR data has much potential for forest applications. In particular, China has the vast territory and different characteristic of forest, so it can play a larger role for forest monitoring.
Acknowledgements
The research work is funded by the National Nature Sciences Foundation Commission of China and the National Pan Dan Project of China. The authors would like to thank NASA/JPL and CCRS for proving the SIR-C/X-SAR and Globe-SAR data.
References
- Beaudoin, A.,T. Le Toan, S. Goze, E. Nezry, A. Lopes, E. Mougin, C.C. Hsu, H.C. Han, J.A. Kong and R.T. Shin, 1994, Retrieval of forest biomass from SAR, data Int. J. Remote Sensing, Vol. 15, No. 15, pp. 2777-2796.
- Chauhan, S., R.H. Lang, and K.J. Ranson. 1990. "Radar modeling of a boreal forest", IEEE Trans. Geosci Remote Sensing, Vol. 29, pp. 627-638.
- Dobson, C,L. Pierce, K. Sarabandi, F.T. Ulaby, and T. Sharik. 1992. "Preliminary analysis of ERS-1 SAR for forest ecosystem studies", IEEE Trans. Geosci. Remote Remote Sensing, Vol. 30, No.2, pp. 203-211.
- Drieman, A.F. J. Ahern, and I.G.W. Corns 1989a. "Visulal interpretation results of multipolarization C-SAR Imagery of Alberta boreal forest", Proceedings IGARSS'89 12th Canadian symposium on Remote Sensing Vancouver, Canada. Vol. 3. pp. 1401-1405.
- Drieman, A., D.G. Leckie, and F.J. Ahern 1989b. "Multiempeoal C-SAR for forest typing in Eastern Ontario". Proceedings IGARSS'89/12th Canadian Symposium on Remote Sensing, Vancouver, Canada. Vol. 3, pp. 1376-1378.
- Durden, J.J. Van Zyl, and H.A. Zebker. 1989. "Modeling and observation of the radar polarization signature of forested areas", IEEE Trans. Geosci, Remote Sensing,Vol. 27, pp. 290-301.
- Ferrazzoli, P., and L. Guerriero, 1995. "Radar sensitivity to tree geometry and woody volume: a model analysis", IEEE Trans. Geosci. Remote Sensing, Vol. 33, No. 2, pp. 360-371.
- Ford P., and D.J. Casey. 1988. "shuttle radar mapping with diverse incidence angles in the rainforest of Borneo", Int. J. Remote Sensing, Vol. 9, No.5, pp 927-943.
- Freeman A. And M. Alves et. Al, 1995, SIR-C data quality and calibration results, IEEE Trans. Geosci. Remote Sensing, Vol. 33, No. 4, pp. 848-8571.
- Hoekman. 1990. "A brief review of microwave forest signature measurement in the Netherlands and the perspoctive for a European research program". Int. J. Remote Sensing, Vol. 11, No. 7, pp. 1193-1203.
- Le Toan, T., A. Beaudoin, I. Riom, and D. Guyon. 1992. "Relating forest biomass to SAR data", IEEE Trans. Geosci. Remote Sensing, Vol. 30, No. 3, pp. 403-411.
- Liao, J.H. D. Guo, and H. Lio 1996. "Forest type discrimination in the northeast of Shibui area using globeSAR data", Processing of the Second Asia Regional GlobeSAR workshop, Science Press, Beijing, China, pp. 94-96.
- Rauste, Y., T. Hame, J, Pulliainen K. Heiska, and M. Hallikainen, 1994, Radar-based forest biomas estimation, Int. J. Remote Sensing, Vol. 15, No. 14, pp. 2797-2808.
- Ranson, J.S. Saatchi, and G. Sun. 1995. "Boreal forest ecosystem characterization with SIR-C/XSAR", IEEE Trans. Geosci Remote Sensing, Vol. 33, No. 4, pp. 867-876.
- Ranson, J.G, Sun, J.F. Weishampei, and R.G. Knox. 1996. "Forest biomass from combined ecosystem and radar backscatter modeling", Remote Sensing Environ, Vol. 59, pp 118-133.
- Richards 1990. "Radar backscatter modeling of forests: a review of current trends", Int. J. Remote Sensing, Vol. 11, pp. 1299-1312.
- Rignot, E.J.M. C.L. Williams, J.Way, and L.A. Viereck. 1994 "Mapping of forest types in Alaskan boreal forests using SAR imagery", IEEE, Trans. Geosci, Remote Sensing, Vol. 32, No. 5, pp. 1051-1058.
- Skriver, H,B.B. Mortensen, P. Grudmandsen. 1994, Calibration and modeling of MAESTRO 1 polarimetric SAR data of a forest area in Les landes, France, Int. J. Remote Sensing. Vol. 15, 14, pp 2737-2754.
- Stofan, R,D.L. Evans, c. Schmullius, B. Holt, J.J. Plant, J. J. Van Zyl, S.D. Wall, and J. Way. 1995. "Overview of results of Spaceborene Imaging Radar-C, X-band synthetic aperture radar (SIR-C/X-SAR)", IEEE Trans. Geosci Remote Sensing, Vol. 33, No. 4, pp. 817-828.
- Sun, G,D.S. Simonett, and A.H. Strahler, 1990. "A radar backscatter model for discontinuous coniferous forests", IEEE Trans. Geosci. Remote Sensing, Vol. 29, pp. 639-650.
- Ulaby, F.T. K. Sarabandi et al, 1990. "Michigan microwave canopy scattering model", Int. J. Remote Sesing, Vol. 11, pp 1223-1253.
- Wang, Y, J, Day and G. Sun. 1993. "Santa Barbara microwave backscattering model for woodlands", Int. J. Remote Sensing, Vol. 14, No. 8, pp. 1477-1493.
- Zebker, H.A., J.J. Van Zyl, S.L. Durden, and L. Norikane, 1991. "Calibrated imaging radar polarimetry. technique, example, and applications", IEEE Trans. Geosci. Remote Sensing, Vol. 29, pp. 942 -961.