| GISdevelopment.net ---> AARS ---> ACRS 1999 ---> Poster Session 6 |
Image Retrieval Theory of
Synthetic Aperture Radiometer for Microwave Remote Sensing
Ji Wu, Xiaolong Dong and
Jingshan Jiang
Center for Space Science and Applied Research, Chinese Academy of Sciences
P.O. Box No. 8701, Beijing 100080, China
Tel: 86-10-62582860, Fax: 86-10-62576921, E-mail: wuji@center.cssar.ac.cn
Tel: 86-10-62582849, Fax: 86-10-62576921, E-mail: calibra@center.cssar.ac.cn
Tel: 86-10-62559575, Fax: 86-10-62576921,E-mail: jsjiang@www.mirit.poac.ac.cn
Keywords: Aperture synthesis, Interferometry,
Microwave radiometer. Center for Space Science and Applied Research, Chinese Academy of Sciences
P.O. Box No. 8701, Beijing 100080, China
Tel: 86-10-62582860, Fax: 86-10-62576921, E-mail: wuji@center.cssar.ac.cn
Tel: 86-10-62582849, Fax: 86-10-62576921, E-mail: calibra@center.cssar.ac.cn
Tel: 86-10-62559575, Fax: 86-10-62576921,E-mail: jsjiang@www.mirit.poac.ac.cn
Abstract:
An approximate image retrieval theory of along track synthetic aperture microwave radiometer for earth remote sensing application is presented. The relation between the ground brightness temperature and the correlation output of a two-element interferometer with different orientation angles is presented. It is also shown that when the data collection window is small relative to the platform altitude, which is normally the case for remote sensing applications, the spatial frequency can be expressed explicitly with the base line geometry and the position where the data is collected. It is shown that using two or three pairs of interferometers along track could reduce the data collection window significantly.
I. Introduction
Adapting radio astronomy synthetic aperture technique in the passive microwave remote sensing area has drawn great attention in recent years [1]-[8]. The most successful approach is the airborne electrical scan thinned array radiometer (ESTAR) developed by C.T. Swift and C.Ruf [1][2] at the Microwave Remote Sensing Laboratory, University of Massachusetts. The main driving force for this development is based on the assumption that the passive microwave measurement could be more accurate on soil moisture than its counterpart, the active measurement for example SAR (Synthetic Aperture Radar), due to its insensitivity to ground surface roughness at lower microwave frequency band when the vegetation cover is thin. Along these issues, the passive microwave remote sensing technology is facing a big challenge on increasing its spatial resolution particularly for space platforms and soil moisture applications.
For earth remote sensing applications, there are several aspects we must consider when are adapt the radio astronomy technology. The first is that the object we are looking at is an extended target and distributed in a linear coordinate. The difference will not only cause a coordinate transformation but also that for earth observation problems we need full response in spatial frequencies, i.e., not only the higher spatial frequencies as in the astronomy case but also the lower spatial frequencies are interested. The second difference is that the relative movement between the platform and the objects is linear for low earth orbit remote sensing satellite but non-linear (due to the rotation of the earth) for astronomy observations. It is then necessary to develop new image theory of synthetic aperture radiometer for remote sensing applications.
Since for low earth orbit or airborne platforms the aperture synthesis can be separated as cross track and along track, the method then can be developed separately too. In fact, the aperture synthesis theory in cross track direction has already been development by Le Vine and Swift, et al [1][2], which is rather similar to the aperture synthesis technique in radio astronomy. As long as the along track direction is considered for aperture synthesis, the number of correlations will be increased rapidly. It implies that although the array is thinned, the total weight of the system will not be reduced due to the complexity of the correlation network. In 1991, the first along track airborne aperture synthesis system was proposed and patented by Hughes Aircraft Company as a patent [6][7]. It is said that this is from an idea of Professor Vernon Soumi from University of Wisconsin in 1980 [7]. The configuration of the patented RADSAR is using two-element interferometer along track and the base line is placed horizontally in the same direction of the aircraft movement. In the same year, Komiyama [3] proposed a space borne configuration using also a two-element interferometer but the base line placed vertically is in the nadir direction. Both systems are requiring a very long data collection window, which will observe the objects at a large range of incidence angles. Since the terrain emission is not isotropic as the stars, therefore these systems have limitations in remote sensing applications.
In this paper, a general correlation response of a two-element interferometer is derived with side looking measurement geometry and arbitrary oriented base line. After taking approximation, this response is expressed in a Fourier transformation form. With this relation, the spatial frequency is defined and it is shown clearly that the platform movement does introduce spatial frequency variation which is equivalent to changing the base line length in the cross track aperture synthesis case.
II.Correlation Measurement of a Two-Element Interferometer
In this section, we will derive the correlation measurement function of a two-element interferometer with its base line arbitrary oriented. The measurement geometry and a principle two-element interferometer diagram is shown in Fig. 1.
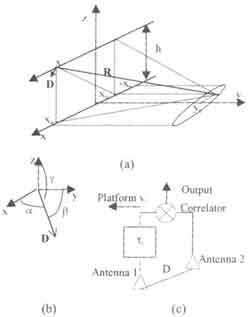
Fig. 1 Measurement geometry (a), base line orientation (b) and principal diagram of a two-element interferometer configuration (c)
In fig. 1 (a), the instantaneous location of the platform is (x,0,h); D is the base line vector shown in Fig. (b) and expressed as
D= D(cos ax+ Cos by +Cos gz) (1)
Where D is the distance between antenna 1 and 2 or the length of the base and a, b, g are the angles between the base line and coordinate axis x, y, z, respectively. Since we only interested the aperture synthesis along track, we assume that the resolution in the cross track direction has already been obtained by other meas. For this reason, now assume a point source is located in the coverage of the antenna at (xo, yc), the range vector then equals to
R= (x0 - x)x + yc y-hz (2)
In fig. 1 (c), the internal circuit delay t1is adjusted such that when the wave is coming in the normal direction of the base line there is no circuit delay between the two channels. It is seen that the interferometry measurement or the correlation output is obtained by multiplying the signals coming from the two channels.
Before we continue, we first assume that the far field condition is satisfied R>>2L2/l. This condition is generally fulfilled by most of the airborne platforms and all satellite platforms. In this case, the waves from the point source at x0 are plane waves and we have R1//R//R2. The difference between R1 and R2 is.
Thus, for a point source located at (x0, yc) the output of the correlator is the multiplication if the signals V1 and V2 from the two receiver channels respectively,
V(x,x0,yc)
=V1(x,x0,ycV*2(x,x0,yc)
=f
=f1(x,x0,yc)f2(x,x0,yc)B(x,x0,yc)e-jkDR (4)
where f1 and f2 are the antenna patterns for channel 1 and 2, E1 and E2 are the field at the apertures of antenna 1 and 2 generated by the point source, and k is the wave number and equals to 2p/l. Since the far field condition is satisfied, the field intensity |E1| and |E2| could be considered as the same, thus B(x, x0, yc) is substitute. For an extended target, the output of the interferometer should be an integration of (4) over the entire image region (-xa, xa). That is,
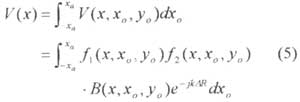
For an extended target, since the microwave emission is random noise and they are not correlated from two different locations, Eqn (5) should still be valid. Furthermore, since the data used to retrieve one image are collected along track when the platform located at different positions, the antenna footprints should not move along with the platform movement within this data collection window. It therefore requires the antenna beam should be carry out a linear scan along x direction.
In addition, for remote sensing applications, while the data are collected for one image, the incident angles should not change too much. This requires a side looking configuration.
Following the above conditions we could take some approximations for Eqn. (5):
1. B(x,xo,yc)» B(xo) within the iamge area and the limited data collection window, the emission of the target are not polarization sensitive;
2. f1(x,xo,yc)» f2(x,xo,yc) » f(xo) under the condition that the two antennas are identical and scanned their beam during the platform movement in the data collection windows such that the beams are pointed to the center of the image area.
Taking these approximations into account, Eqn. (5) becomes to,
Eqn.(6) is an integral equation that can be solved by many different numerical methods. However, in order to understand the image mechanism and to guidance the design. We should have more in-depth discussions. For this purpose, we now consider the possibility to take further approximations.
and taking the first order approximation of (7) get,
This is the first order approximation on x/0 terms and second order approximation on other terms. We now define the spatial frequency u, let,
Eqn. (6) is then equal to.
It is seen that (10) is a a one-dimensional Fourier transform. Its inverse is
and the relation between x/ and u is given by (9).
III Base Line Oriented and Spatial Frequences
In the preceding section we have derived and defined the spatial frequencies as in (9), which is a function of both measurement geometry and base line geometry including the length and oriented of it. It is recognized that u is linearly related with the platform movement x' according to this first order approximations.
For a good quality image retrieval in the along track direction and particularly for remote sensing applications, we would like to have the full spatial frequency response up to the limit that provided by the base line D. therefore, there is an optimum design for the base line orientation. According to u, cosb is the slope of the line function which will determine the measured spatial range. For a given length base line, large slope corresponds a large coverage of spatial frequency of a fixed data collection window. For this reason, we take the derivative of the slope S of (9) and let it equals to zero,
Solve and obtain,
cosb=y1csina=sin qosina (13)
Where qo is the incident angle while the platform is at the origin. Substitute this into (9) we obtain the most efficient spatial frequency,
Since appears as the intercept of the line function in (9) and (14), it has to be selected carefully. Fig. 2 shows that two different a values give completely different spatial frequency response/coverage. Noted that the spatial frequency is normalized by the base line length D/l in the figure.
Fig. 2 Spatial frequency bandwidth,
IV Numerical Simulation and Result
To show the validation of the above analysis, we now taking a numerical simulation of a one dimensional along track aperture synthesis.
Let the platform altitude h be 800 km and the image area is 400 km aside from nadir or yc = 400 km. The image data has a dimension of 180 km which means that xa=90 km and in accordance the data collection window is 180 km long which gives x ranging from -80 to 80 km. This measurement geometry gives the incident angle changing from 26.56 to 28.5 degrees. The gap between the date collection windows of two images are 20 km which gives 2.56 seconds of time for the antenna to scan back preparing for the next image where the speed of the spacecraft is assumed to be 7.8 km per second.
According to the discussions in Section III, we would use three base lines to cover the spatial frequency response needed. The geometry of those base lines is listed in Table1.
From the sampling criteria, it is calculated that Dx= 80 m for this example and Du»4.97. For each base line given above, three examples will be taken at x=-80, 0 and 80 km of each baseline. For u = 0., we take an auto-correlation measurement of any of the four antennas. With all these samples, we will have V (u, where u = 0, ± 4.97, ±9.94, ±14.91, ±19.88, ±24.85, ±29.82. ±34.79, ±39.76, ±44.73), in total 19 sampling points for inverse. Fourier transform. Noted that measured but obtained from V(u)=V*(-u).
Fig.3 shows four different inverse Fourier transform theory has the ability to provide an approximate retrieved image. Since the more to the edges of the image, the bigger error will occur in the approximation, the result at the edges of the coverage has some degree of ambiguities. A suggested procedure for practice image retrieval is to use numerical optimization. However, the Fourier transform theory could still be used as the guidance of the system design and as the initial point of the numerical optimization.
VI. Conclusions
The image retrieval theory for along track synthetic aperture radiometer is presented. As conclusions, we now would like to address the following points:
- For along track aperture synthesis measuremnt, side looking measurement is a better configurations that nadir looking.
- Platform movement does provide some spatial frequency variations in the along track direction, however, it is important to chose the optimum base line length and oriented for a particular measurement geometry and spatial resolution required.
- The data collection window along track should be smaller than the image area in the along track direction since the antenna beam should scan during the measurement and should scan back after the measurement for the previous image and preparing for the next image. During the measurement, the beam should pointing to the center of the image area.
- Since the along track aperture synthesis can thin the aperture very much , it will use mush less element and correlate's than the conventional two dimensional aperture synthesis technique, for example the Y shape or U shape synthetic aperture radiometers.
References
- Ruf, C. S., C. T. Swift, et. al., " Interferometeric synthetic aperture microwave radiometry for the remote sensing of the earth", IEEE Trans. GRS, Vol.26, pp.597-611, 1998.
- Le Vine, D.M., M. Kao, et al., "Inintail results in the development of a synthetic aperture microwave radiometer", IEEE Trans. , GRS, Vol. 28, pp.614-619, 1990.
- Komiyama, K., "High resolution imaging by super synthesis (SSR) for the passive microwave remote sensing of the earth", Electronic Letters, Vol.27, pp.389-390.
- Laursen, B., et al., " The TUD synthetic aperture radiometer demonstrate model", Proceeding of the Remote Sensing of the Environments, Rome, Feb., 1994.
- Martin-Neira, M., et al, "Integration of MIRAS breadboard and future activities", Proceedings of IGARSS'96, 1996.
- Edelsohn, C., et al., "RADSAR (RADiometric SAR) experimental results", Proceeding of IGARSS'98, 1998.
- US Patent No. 4,990, 925.
- Dong, X.L., J. Wu, J.S. Jiang, "The signal analysis and imaging of synthetic aperture radiometer", Proceedings of IGARSS,98, 1998.
- Jackson, T.J., D.M. Le Vine, C.t. swift, T.J. Schmugge and F.R. Schiebe, "Large area mapping of soil moisture using the ESTAR passive microwave radiometer in Washita'92", Remote sensing of Environment Vol. 53.
- Le Vine, D.M., et al., "Passive microwave remote sensing with the synthetic aperture radiometer ESTAR during the southern great plane experiments", Proceeding of IGRASS'98, 1998.
- Thompson, A.R., J.M. Moran and G.W. Swenson, Jr. Interferometry and synthesis in radio astronomy, Krieger Publishing Company, Malabar, Florida, 1994.
 |
 |
 |
 |
| Fig.4 Results of
numerical simulation, -Original , ----retrieved | |
| a | b | g | D/l | Spatial Frequency Coverage | |
| No.1 | 79.9 | 63.9 | 151.7 | 56.45 | 4.97~14.91 |
| No.2 | 65.9 | 65.9 | 144.7 | 60.86 | 19.88~29.82 |
| No.3 | 54.4 | 68.7 | 136.7 | 68.31 | 34.79~44.73 |