| GISdevelopment.net ---> AARS ---> ACRS 1999 ---> Poster Session 6 |
Fy-1c polar orbiting
meteorological satellite of china: Satellite, ground system and
preliminary applications
Yujie Liu, Wenjian Zhang,
Yang Zongdong
National Satellite Meteorological Center (NSMC)
China Meteorological Administration (CMA)
Beijing 100081, P. R. China
IntroductionNational Satellite Meteorological Center (NSMC)
China Meteorological Administration (CMA)
Beijing 100081, P. R. China
The first generation of polar orbiting meteorological satellite project FY-1 series has four satellites, FY-1A, 1B, 1C and 1D. FY-1A and 1B were launched successfully on September 7, 1988 and September 3, 1990 respectively. They were all experimental satellites.
On May 10, 1999, FY-1C, the third polar orbiting meteorological satellite with a ten-channel radiometer as the primary sensing instrument, was launched successfully. The FY-1C satellite was designed and manufactured by the Ministry of Aerospace of China according to the requirement specified by China Meteorological Administration (CMA). The successful launching of FY-1C is a major development in Chinese scientific and technological modernization of meteorology. With launching of this satellite, we have ability to get the remote sensing data not only over China but also over the world. This data will be useful in analysis of meteorology. hydrology, climate research, agriculture and environment mornitoring. To compare with FY-1A and 1B, FY-1C is more advanced. It has been providing observing data to users over the world every day since the first day after launch. It is in operation now.
The Characteristics of FY-1C
FY-1C is a hexahedron of 1.42m x 1.42m x 1.2m. With three solar cell arrays, the total length of the satellite is 10.556m. The attitude of FY-1C is 3-axis stabilized with an accuracy less than 0.5 degrees. The designed life time is two years. The orbit parameters of FY-1A, 1B and 1C are in table 1.
Table 1 The orbit parameters of FY-1A, 1B and 1C
| Satellite | FY-1A | FY-1B | FY-1C |
| Launch date | September 7,1988 | September 3, 1990 | May 10, 1999 |
| Orbit | Sun-synchronous | Sun-synchronous | Sun-synchronous |
| Altitude (km) | 901 | 901 | 863 km |
| Period (minutes) | 102.86 | 102.86 | 102.301minutes |
| Inclination (degrees) | 99.0 | 98.9 | 98.79 |
| Eccentricity | <0.005 | <0.005 | <0.00188 |
| Descending Node(LST) | 03:30 | 07:50 | 08:34-09:00 |
| Attitude Control | Three-axis stabilized | Three-axis stabilized | Three-axis stabilized |
Sensor Specification
The main payload on board the satellite includes two 10-channel VIS/IR scanning radiometers working in a mutual back up mode, they can be switched according to the tele-command. MVISR is the new instrument. The most significant change to the MVISR is ten channels sensor, including 4 VIS channels, 3 near IR channels, 1 short wave IR channel and 2 long wave IR channels. Table 2 is the specification of MVISR. To compare with FY-1A and 1B, the new channels have been added are used to aid in improved snow and cloud discrimination and aerosol detection as well as heat source detection for forest fire monitoring, SST and Water vapor calculation and so on. It enables the more powerful observations to the land and oceans. The instantaneous field of view of the MVISR is 1.2 mrad, which makes 1.1 km resolution at the sub-satellite point. The channel characteristics and purpose of the radiometer are shown in Table 3.
Table 2 The Specification of MVISR
| Scan Rate | 6 line/pre second |
| Channels | 10 |
| Word/pre scan line | 2048 for HRPT and LDPT 1018 for GDPT |
| Scan Angle | ±55.4° |
| Sub-point resolution | 1.1km |
| Quantification level | 10bit |
| Calibration accuracy | VIS and Near-IR 5 - 10%r IR ±1K(300K) |
Table 3 The Channel Characteristics
and Purpose of MVISR
| Channel | Wavelength (mm) | Primary Use |
| 1 | 0.58-0.68 | Daytime cloud, ice and snow, vegetation |
| 2 | 0.84-0.89 | Daytime cloud, vegetation |
| 3 | 3.55-3.95 | Heat source, night cloud |
| 4 | 103.-11.3 | SST, day/night cloud |
| 5 | 11.5-12.5 | SST, day/night cloud |
| 6 | 1.58-1.64 | Soil moisture, ice/snow distinguishing |
| 7 | 0.43-0.48 | Ocean color |
| 8 | 0.48-0.53 | Ocean color |
| 9 | 0.53-0.58 | Ocean color |
| 10 | 0.90-0.985 | Water vapor |
Characteristics of Data Transmission
The data transmission has several upgrades to FY-1A and 1B. There are three data transmission mode on board of FY-1C, HRPT, GDPT or LDPT.
HRPT is the High Resolution Picture Transmission. The format is very similar to NOAA/HRPT, except that the data transmission rate is 1.3308 Mbps. The transmission modulation is PSK and bit format is split phase. The transmission frequency is 1700.5Mhz.
GDPT and LDPT are delayed picture transmission. The on board data storage capacity is 300 minutes. Therefore, FY-1C satellite and the ground system can receive the Global Area Coverage (GAC) data for four selected channels (channel 1,2,4,5) with reduced resolution in 4 km for day time only(defined as Delayed Global Picture Transmission). As an alternative, the ground system can also receive 20 minutes orbit observational data for ten channels with the original resolution at any region of the world with the on board data storage capacity (defined as Delayed Local Picture Transmission, DLPT). As same as HRPT, the data transmission rate of GDPT and LDPT are 1.3308 Mbps. The transmission modulation is PSK and bit format is split phase. The transmission frequency is 1708Mhz.
FY-1C Data Receiving and Processing System
After years of investigation, analysis and applications of TIROS-N, FY-1A and 1B data processing system, NSMC set up the new satellite data receiving and processing system before the FY-1C satellite was launched. It is the upgraded of the old system. This system has three satellite data receiving stations located in Beijing, Guangzhou and Urumqi respectively and a data processing center in NSMC/CMA. The whole system equipped with new receiving facilities, communication computers, VSAT system, HP and SGI work stations and many kinds of peripherals. It is a large scale complicated system which can be used to receive, transmit and process FY-1C satellite data, and it is also compatible of receiving and processing the data from NOAA polar-orbiting meteorological satellites of USA. This system designed to be operated automatically for satellite data receiving, processing, products generating, distributing and archiving.
Satellite Data Receiving
Polar orbiting meteorological satellite data is received by three data acquisition stations in Beijing, Guangzhou and Urumqi. The data received from both FY-1C and NOAA satellites in three stations are transmitted to the data processing center(DPC) in real time. Three stations are equipped with S-bend antenna, receiver, communication system and some special interface such as bit/frame sychronizer, GDPT and LDPT ingester, HRPT/GDPT transmission interface, telemetry interface and so on. HRPT, GDPT or LDPT data received in Guangzhou and Urumqi stations are relayed to DPC via VSAT. The data received in Beiging ground station are transmitted directly to the DPC via optical fiber. Figure 1 is the configuration of three stations.
Figure 1 The configuration of three stations
Satellite Data Processing
FY-1C and NOAA satellite data is processed in Data Processing Center in NSMC/CMA. The Satellite data processing includes data preprocessing, processing and products generation. Figure 2 is the over view of the FY-1C data flow and products processing system.
The satellite data in this system is processed into four levels, the level 1A, 1A.5, 1B, 1C and 1D. Level 1A is the raw data of CHRPT, GDPT and LDPT. Level 1A.5 and 1B are preprocessed data sets. 1A.5 is for following processing in real time. 1B is for data archive purposes, external user access and any future required reprocessing. Level 1C is the inter-mediate data sets for final products processing. Level 1C include two data sets. One is the regional data in full resolution with 15 type of data that include satellite data of 10 observing bands and solar zenith angle, satellite zenith angle, azimuth angle between sun and satellite, the observing time and NDVI. Another One is the globe data in 4 km resolution with 9 type of data that include satellite data of 4 selected bands and solar zenith angle, satellite zenith angle, azimuth angle between sun and satellite, the observing time and NDVI. Level 1D is the final products.
Figure 2 FY-1C data flow and products processing system.
Products from FY-1C and Preliminary Applications
According to the requests from meteorology, hydrology, climate changes, agriculture and environment monitoring, FY-1C system is designed to produce many kind of products from 10 bends data. These products can be classified into four types. There are image, land, ocean and atmosphere products. Each type has several products.
Image Products
Images are very important products in FY-1C processing system. They play a great role in disaster monitoring, such as forest fire, flooding, blizzard fatality etc. Image products of FY-1C include stretched gridded image, special event images, orbital images, image mosaics in regional and globe size and products images. Table 4 is specification on image products from FY-1C. Figure 3 is an example of image mosaic from FY-1C in polar stereographic projection over North hemisphere.
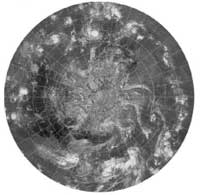
Figure 3 The image mosaic over North hemisphere from FY-1C
Table 4 The Specification of Image Products
| Products | Spatial Resolution | Geographic Coverage |
Output Format | Schedule |
| Orbital Images | 1.1km, 2km, 4 km | Pass by pass | gridded image | daily |
| Stretched Gridding | 1.1 km, 2 km, 4 km | Pass by pass | gridded image | daily |
| Polar Image Mosaic |
3.7 km-equator 7.4 km- equator |
Over Asia Global | image, archive tape | daily |
| Mercator Image Mosaic | 5.7 km- equator 11.4km- equator |
Over Asia Global | imagery | daily |
| Special Event Imagery |
1.1 km | Selectable orbit segments |
imagery | daily |
| Products Imagery | Same as Products | Same as Products | imagery | Same as Products |
Land products
Land products are used to monitor the variation of land cover and environment changes, such as to use vegetation index to monitor the crop growing condition over China or world, to use snow cover data in research of climate changes. FY-1C system provides many products over land area in both regional and global. Table 5 is the summary of land products. Figure 4 is an example of vegetation index.
Figure 4 An example of vegetation index in August 1999
Ocean Products
FY 1C satellite has 1 short wave IR channel, 2 long wave IR channels and 3 ocean color observed bands. These data can be used to produce many products over ocean, such as sea surface temperature, sea ice and ocean color and so on. Table 6 is the summary of ocean products. Figure 5 is an example of global SST image.
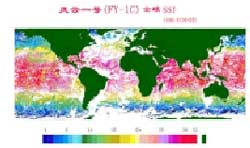
Figure 5 An example of global SST image
Atmosphere Products
FY-1C atmosphere products include cloud parameter, out going long wave radiation(OLR) and water vapor total content. These products are very useful for weather analysis and research of climate changes. Table 7 is the summary of atmosphere products. Figure 6 is the contour of OLR over China.
Figure 6 The contour of OLR over China.
Summary
Since launch of FY-1C, the satellite has been working in good condition. It passed through the orbit test and checkout period perfectly. It provides both HRPT and GDPT data day and night. Many countries over the world can receive HRPT data from FY-1C satellite every day. The data processing system in China has been providing many products for research of meteorology.hydrology, climate changes, agriculture and environmental monitoring. China is willing to share FY-1C satellite data and products with the international community, and thus to make contribution to the people worldwide.
Table 5 Summary of Land products
| products | Resolution | Geographic Coverage |
Output Format |
Schedule |
| Vegetation Index |
0.01° x 0.01° 0.04° x 0.04° |
Asia Global | imagery, output archive tape |
daily |
| Snow Cover |
0.01° x 0.01° 0.05° x 0.05° |
15°- 55°N 70°-155°E |
imagery, output archive tape |
daily |
| Surface Albedo |
0.01° x 0.01° 0.05° x 0.05° |
15°- 55°N 70°-155°E |
imagery, output archive tape |
as request |
| Surface Temperature |
0.01° x 0.01° 0.05° x 0.05° |
15°- 55°N 70°-155°E |
contour chart archive tape |
average of 5 or 10 days |
| High Resolution Data |
0.01° x 0.01° | over China | archive tape | daily |
Table 6. Summary of Ocean products
| Products | Resolution | Geographic Coverage |
Output Format |
Schedule |
| SST | 0.5° x 0.5° | 0°-50°N 105°-155°E |
output chart archive tape |
|
| SST | 0.5° x 0.5° | Global | output chart archive tape |
daily |
| Sea Ice | 0.02° x 0.02° 0.05° x 0.05° |
36°- 41°N 117.5°-122.5°E |
imagery, output archive tape |
daily in winder |
| Ocean Color |
0.01° x 0.01° 0.05° x 0.05° |
15°- 55°N 70°-155°E |
imagery, output archive tape |
daily |
Table 7. Summary of Atmosphere products
| Products | Resolution | Geographic Coverage |
Output Format |
Schedule |
| Cloud Parameter |
0.5° x 0.5° | 0°-50°N 105°-155°E |
output chart archive tape |
|
| Cloud Parameter |
0.5° x 0.5° | Global | output chart archive tape |
daily |
| OLR | 0.5° x 0.5° | 0°-50°N 75°-150°E |
contour chart archive tape |
average of 1,5,10 or 30 days |
| OLR | 0.5° x 0.5° | Global | contour chart archive tape |
average of 1,5,10 or 30 days |
| Water Vapor Total Content |
0.5° x 0.5° | 36°- 41°N 117.5°-122.5°E |
imagery, output archive tape |
daily
in winder |