| GISdevelopment.net ---> AARS ---> ACRS 1999 ---> Poster Session 6 |
Flood detection using
multitemporal Radarsat and ERS SAR data
Ping Chen, Soo Chin Liew
and Hock Lim
Centre for Remote Imaging, Sensing and Processing,
National University of Singapore,
Lower Kent Ridge Road, Singapore 119260
Tel: (65) 8748029, Fax: (65) 7757717,
E-mail: crschenp@nus.edu.sg
Keywords: flood, ERS SAR, RADARSAT SAR,
multi-temporal images Centre for Remote Imaging, Sensing and Processing,
National University of Singapore,
Lower Kent Ridge Road, Singapore 119260
Tel: (65) 8748029, Fax: (65) 7757717,
E-mail: crschenp@nus.edu.sg
Abstract
A study using combined RADARSAT and ERS SAR images in flood detection is described in this paper. The availability of SAR data from the RADARSAT and ERS satellites offers an opportunity for continuous observation of flood events. This makes it possible to monitor the progress of flood in near real time and to produce accurate, rapid and cost effective flooding maps. The objective of this study is to monitor flood by using multitemporal and multiplatform SAR data. Eight RADARSAT (standard mode S6, S4 and S1), five ERS PRI SAR and five SPOT multispectral optical images were used in this study. The images were acquired over the Mekong delta in Vietnam from June 1997 to Dec 1997. The SAR images were first filtered, co-registered and calibrated. Then the inundated areas were extracted from the SAR images by using thresholding methods. The majority filter was used for post processing of the flooding maps. The results were compared and evaluated with SPOT multispectral images serving as the "ground truth". The characteristics of RADARSAT and ERS data for flood detection and the determination of threshold value are discussed. In this paper, we present the time series of flooding maps in 1997. The result of this study verified the effectiveness of the SAR data for flood monitoring.
Introduction
Although the Mekong Delta’s area occupies only 5% of the entire watershed of the Mekong River, it collects all the water from the Mekong River, one of the big river systems in Asia. Floods are almost annual events in the Delta. The floods usually occur during the rainy season from May to December and culminate around October and November. Remote sensing provides an effective means of obtaining a synoptic view of areas affected by floods for monitoring the progress of a flooding event. Multitemporal optical images such as the SPOT images would be able to detect flooded areas. However, the use of optical imagery is often hampered by the presence of cloud covers during the flood seasons. Synthetic Aperture Radar (SAR) imagery acquired by the RADARSAT and ERS satellites can be used for flood monitoring due to the cloud penetrating capability of SAR. Therefore, the use of SAR imagery acquired at appropriate time would greatly help in the compilation and timely updating of flooding maps.
A flood map of the Mekong Delta during a single date in 1996 was composed using a RADARSAT Scan SAR imagery (Lai, 1998). In this study, we monitor the flood of 1997 in the Mekong Delta by using multitemporal and multiplatform SAR data with high time and spatial resolution. As the RADARSAT and ERS SAR have different characteristics, it is necessary to evaluate the performance of these data for flood detection.
Study Area and Available Data
The study area is an area about 100 km by 91 km located in the Mekong River Delta. The location of the study area is shown in Figure 1. The data set consists of eight RADARSAT (standard mode S1, S4 and S6) images, five descending mode ERS-2 PRI images and five SPOT multispectral images which were acquired from June 1997 to Dec 1997. The acquisition dates of imagery used for this study are listed in Table 1.
The SAR images of the RADARSAT and ERS were used for the flood detection, while the SPOT images were used to evaluate the results. As the SPOT data were acquired in almost same period as that of SAR data it offers a high degree of reliability for checking the results.
Fig. 1: Location map of the Study Area
Table 1: The data used in this study
| Date | ERS | RADARSAT | SPOT |
| Jun 29 | Ö | ||
| Jul 26 | S6 | ||
| Jul 29 | S1 | ||
| Aug 3 | Ö | ||
| Sep 6 | Ö | ||
| Sep 7 | Ö | ||
| Sep 28 | S1 | ||
| Oct 8 | S4 | ||
| Nov 16 | Ö | ||
| Nov 17 | Ö | ||
| Nov 23 | S6 | Ö | |
| Nov 26 | S1 | Ö | |
| Dec 10 | S4 | ||
| Dec 19 | Ö | ||
| Dec 20 | S1 | ||
| Dec 21 | Ö |
Data Processing Method
The calibrated SAR Precision Image (PRI) products of ERS and RADARSAT were used in this study. The images were acquired and processed at the ground station of the Centre for Remote Imaging, Sensing and Processing (CRISP), Singapore. Each image was first low-pass filtered using a 5 × 5 averaging window and then downsampled to a pixel size of 50m × 50m. All the images were co-registered and calibrated. An edge-preserving speckle removal filter based on the adaptive Wiener filter for multiplicative noise was applied afterwards.
The SAR backscattering coefficient (s ° ) in dB was computed from the RADARSAT and ERS SAR images using the equation
where DN is the digital pixel number, K is a calibration constant and q is the incidence angle.
For RADARSAT scenes processed at CRISP, the calibration constant K has the same value for all pixels within the same image.
The inundated areas were extracted using the threshold method, and the threshold conditions were set as follows:
- For RADARSAT images,s °I£ TR where,s°I is backscattering coefficient of the image and TR is the threshold value.
- For ERS images, s°d/s°b£ T AND s°b£TE where,s °d and s°b are the SAR backscattering coefficient in dB for the data during flood and before flood respectively.
- The values of TR and TE were determined from the mean of the selected AOI (area of interested) or the histograms of the data. The images were post processed with 3 by 3 majority filter after flood detection.
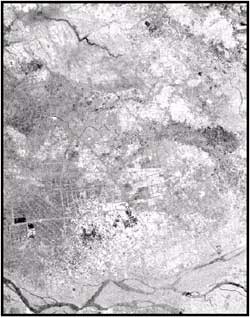
Fig. 2 shows part of an ERS SAR image of the test area acquired on June 29, 1997, during the start of the rainy season. Most of the area has not been inundated. In contrast, a Radarsat SAR (S4) image of the same area acquired on October 8, 1997 during the peak of the flood is shown in Fig. 3. The inundated areas (dark areas) are clearly delienated from the non-inundated areas in the RADARSAT SAR image due to the high incidence angle. The linear criss-crossing features seen in the image are roads or banks of canals on higher ground.
 |
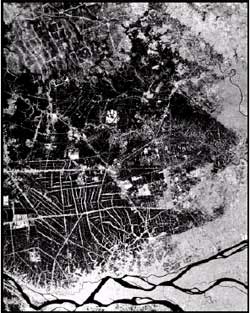 |
| Fig. 2: ERS image acquired on June 29, 1997 during the beginning of the raining season. | Fig. 3: Radarsat image (S4) acquired on October 8, 1997 at the peak of the flood. The dark areas are inundated. |
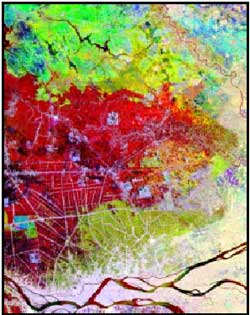
An example of using ERS and RADARSAT SAR images in monitoring the progress of flood is shown in Fig. 4. This image is a multitemporal colour composite image composed from three SAR images acquired at three different dates (Red: ERS on Aug 3; Green: ERS on Sep 7; Blue: RADARSAT S4 on Oct 8, 1997). The dark areas in the image are the areas inundated on all three dates. The areas in red tones were not inundated on the first date (Aug 3) but inundated in the Sep and Oct images. The areas in yellow tone were flooded later in October. The cyanish areas were flooded in Aug, but the water either receded or the water was covered by vegetation during the later dates.
 |
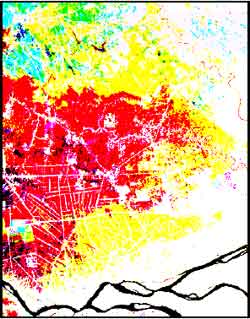 |
| Fig. 4: Multitemporal colour composite image of the test area, showing the progress of the flood. (Red: ERS on Aug 3; Green: ERS on Sep 7; Blue: RADARSAT S4 on Oct 8, 1997). | Fig. 5: Composite of three flood maps corresponding to the image shown in Fig. 4. |
The RADARSAT images show a clear distinction between water and land due to a higher incidence angle. Therefore, it is easy to detect the flooded area by simply applying a threshold. In the ERS images, the inundated areas were extracted from the change in the SAR backscatter. The Jun 29 ERS image is taken as the before-flood reference image. For the later images acquired during the flood period (July to December 1997), a pixel is classified as an inundated pixel if its backscatter decreases by 3 dB or more when compared to the corresponding pixel in the reference image. A flood coverage map can thus be obtained for each ERS or RADARSAT SAR image. Fig. 5 shows the composite flood map composed from three flood coverage maps derived from the three SAR images used to compose the colour composite image in Fig. 4. The colours show the areas flooded at different time. The colours have been assigned so that they correspond to the colours appearing in the colour composite SAR image of Fig. 4.
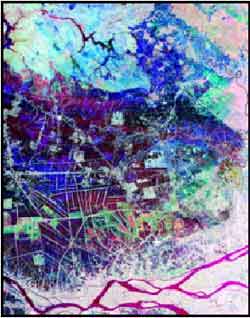
Fig. 6 is a multitemporal colour composite image composed from three SAR images acquired at three different dates (Red: ERS Nov 16; Green: RADARSAT S6 Nov 23; Blue: ERS Dec 21, 1997) during the later part of the flood season. The corresponding flood coverage map is shown in Fig. 7. In this figure, The dark areas still remained inundated by Dec 21, but the flood has receded in most areas (coloured blue, cyan and magenta) by Dec 21.
 |
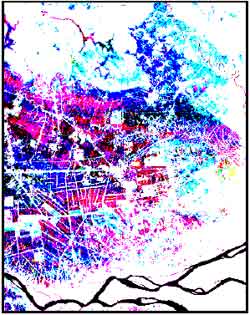 |
| Fig. 6: Multitemporal colour composite image of the test area, showing the recession of the flood. (Red: ERS on Nov 16; Green: RADARSAT S6 on Nov 23; Blue: ERS on Dec 21, 1997). | Fig. 7: Composite of three flood maps corresponding to the image shown in Fig. 6. |
Conclusion
In this study, ERS and RADARSAT SAR images have been used to map the flooded areas in a part of the Mekong River Delta from Jun to Dec 1997. Flood coverage maps were produced and the evolution of the flood event could be studied. The results of this study illustrated the effectiveness of using SAR data for flood monitoring. The main problem anticipated in operational application of space-borne SAR data is the availability of data for near time monitoring. ERS has a repeat cycle of 35 days and by itself, does not have sufficient temporal coverage. RADARSAT is able to image at several incidence angles, and hence has an increased revisit capability of just a few days. At higher incidence angles, inundated areas are better discriminated from non-inundated land. Combined use of ERS and RADARSAT data will provide high temporal revisit capability for flood monitoring.
References
- Lai Anh Khoi & Bui Doan Trong, 1998. Application of Radar Imagery for Flood Monitoring in the Mekong Delta, Proc. the Euro-Asia Space Week on Cooperation in Space, pp. 219-224