| GISdevelopment.net ---> AARS ---> ACRS 1999 ---> Poster Session 5 |
Estimate of Methane Emission
from Wetlands in Kanto, Japan using Remote Sensing and GIS
Hideshi Fujiwara, Toshiaki
Imagawa and Kenji Matsumori
National Institute of Agro-Environmental Sciences
3-1-3 kannondai, Tsukuba, Ibaraki 305-8604, Japan
Tel : +81-298-38-8277 Fax: +81-298-38-8277
E-mail :hfuji@niaes.affrc.go.jp
Abstract
National Institute of Agro-Environmental Sciences
3-1-3 kannondai, Tsukuba, Ibaraki 305-8604, Japan
Tel : +81-298-38-8277 Fax: +81-298-38-8277
E-mail :hfuji@niaes.affrc.go.jp
The global role of wetlands as animal habitats and protection against greenhouse gas emissions is vital and varied. Wetlands contribution to global warming through the emission of methane is unclear, and requires that we clarify wetland distribution to determine regional amounts of methane gas emission. We made wetlands maps of Kanto, Japan, using satellite data and numeric land information on rice and lotus paddies and natural marshlands along rivers, and roughly estimated methane gas emission based on these maps and a digital soil map.
1.Introduction
Organic matters in marshlands decompose slowly due to the low temperature of wet ground and carbon is accumulated in the soil. Carbon dioxide density in the atmosphere is decreased by marshlands, restricting the so-called greenhouse effect contributing to global warming. Wetlands are, conversely, seen as a source of greenhouse gas emission, however, due to methane generated in wet soil through anaerobic decomposition. The degree of this presumed contribution to global warming is unclear, although it is believed that greenhouse gas generation and absorption in wetlands influence global gas movement. Due to the vastness of the area and absorption in wetlands influence global gas movement. Due to the vastness of the area occupied by wetlands, it is necessary to evaluate their gas emission and absorption, which we did by studying regional land conditions such as soil type and land use.
2.Material and Methods
The area in studies was eastern Japan's kanto plain, where wetlands maps were made based on satellite data and numeric land information issued by Japanese National land Agency. Landsat TM data from spring and summer 1987 were used. Images were classified after geographic correction and extraction and the land cover divided to construct maps of rice and lotus paddies and natural marshlands along rivers. Paddy distribution was extracted from a land use dataset of numeric land information to make maps of rice paddies. A soil map of the same region was based on a soil dataset. The geographic information database integrating these maps is basic for understanding greenhouse gas generation and absorption. We studied methane gas generation for each rice paddy soil type (Japan Soil Association, 1996) to be integrated into the database, and the regional amount of methane emission from rice paddies estimated.
3.Results and Discussion
In the paddy map based on satellite data analysis (Fig. 1), border polygons were overlapped and area totaled for each city. In 16 cities in Ibaraki Prefecture, lotus paddies exceed 10 ha. Areas based on satellite data were compared with administrative statistics and a significant correlation found (R2=098). Values based on satellite data were 25% smaller than statistics, however. Since the area of individual lotus paddy groups was small and their borders with other land covers long, we concluded that mixel areas are large and lotus paddy areas small. Rice paddy area based on satellite data was also compared with statistics and a significant correlation found (R2=0.98). Regional differences in rice growing throughout Kanto plain, however, greatly influenced extraction accuracy, making it difficult to map rice paddies based entirely on satellite data.
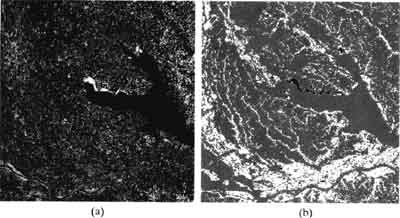
Fig. 1 A paddy map based on satellite data.
(a) Original Landsat TM image
(b) Distribution of lotus paddy (black) and rice paddy (white)
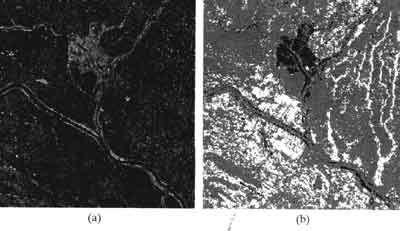
Fig.2 A marshand map based on satellite data.
(a) Original Landsat TM image
(b) Distribution of lotus paddy (black) and rice paddy (white)
Based on the rice paddy map made from a land use map dataset of numeric land information we recorded methane emission for rice paddies (Fig. 3). Border polygons were overlapped and regional methane emission calculated for each prefecture, resulting in values 20% or more greater than values previously reported (Japan Soil Association, 1996). Land use data showed rice paddy area greater than that actually cultivated. This report only shows the amount of methane emission in each prefecture, and our results should prove to understanding regional methane emission despite such inaccuracies.
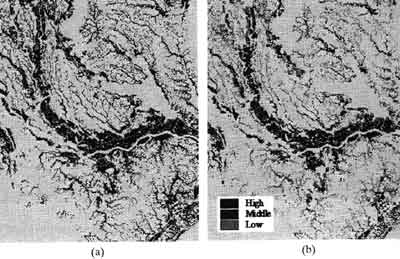
Fig. 3 Estimation of methane emission.
(a) A paddy map based on numeric land information issued by Japanese National Land Agency.
(b) Classification of methane emission from rice paddies.
| High : | 25~ g/m2/year |
| Middle : | 10~25g/m2/year |
| Low : | ~10g/m2/year |
References
- Japan Soil Association (1996) Report of greenhouse gases movement from soil.
- Lilly, A. and Matthews, K.B. (1994) A soil wetness class map for Scotland: new assessments of soil and climate data for land evaluation. Geoforum 25, 371-379.
- Skiva, u., McTaggart, I.P., Smith, K.A. Hargreaves, K.J. and Fowler, D. (1996) Estimates of nitrous oxide emissions from soil in the UK. Energy Conserv. Mgmt 37, 1303-1308.
- Yagi, K. and Minami, K. (1990) Effect of organic mater application on methane emission from Japanese rice fields, Soil Sci, Plant Nutr. 36,599-610.
- Yagi, K., Tsuruta, H., Kanda, K. and Minami, K. (1996) Effect of water management on methane emission from a Japanese rice paddy field: Automated methane monitoring. Global Biogeochemical Cycles 10, 255-267.