| GISdevelopment.net ---> AARS ---> ACRS 1999 ---> Poster Session 5 |
Monitoring Mangrove Forests
using Remote Sensing and GIS
Yousif Ali Hussin Mahfud M.
Zuhair Michael Weir
Forest Science Division
International Institute for Aerospace Survey and Earth Science (ITC)
P.O. Box 6, 7500 AA, Enschede, The NetherlandsFax: (31) 53-4874-399
Email: hussin@itc.nl, http://www.gisdevelopment.net/aars/acrs/1999/ps5/weir@itc.nl
Forest Science Division
International Institute for Aerospace Survey and Earth Science (ITC)
P.O. Box 6, 7500 AA, Enschede, The Netherlands
Email: hussin@itc.nl, http://www.gisdevelopment.net/aars/acrs/1999/ps5/weir@itc.nl
Keywords: Mangrove, monitoring, coastal zone, deforestation, remote sensing, GIS, radar, optical, satellite images
Abstract
Mangrove forests form one of the primary coastal ecosystems in the tropical and subtropical regions of the world. Mangrove ecosystems are very sensitive and fragile. The pressures of increasing population, and the resulting expansion of agriculture and industrial and urban development, have caused a significant proportion of the world’s mangroves to be destroyed. Reliable and timely information is therefore required in order to monitor and manage the remaining mangrove resources. This paper describes research to compare the ability of three different radar satellite imaging systems and three different optical satellite systems to detect mangrove deforestation in the delta of the Mahakam River, East Kalimantan, Indonesia.
1. Introduction
Mangrove forests form one of the primary coastal ecosystems in the tropical and subtropical region of the world. They are biologically diverse and have therefore traditionally been utilized for food resources, firewood, charcoal, timber and other minor products. However, mangrove ecosystems are very sensitive and fragile. In recent years, the pressures of increasing population, and the resulting expansion of agricultural land and industrial and urban development, have caused a significant proportion of the world’s mangrove resource to be destroyed. In addition, significant areas of mangrove swamps in Indonesia and other regions of Southeast Asia have been developed to create ponds for the commercial production of fish and shrimps.
Information is crucial in order to assess mangrove deforestation, to monitor the state of the remaining mangrove forests and ensure their sustainable management. In mangrove areas, the task of collecting information by ground inventory is extremely difficult, time consuming and, therefore, expensive. For this reason, remote sensing is an attractive means of obtaining data for defining deforested areas and updating management plans. In Indonesia, a serious drawback to using optical satellite images for mangrove monitoring has been the unavailability of cloud-free images at the time of interest. The advent of radar systems is expected to resolve this problem. Unlike optical systems, radar systems can be operated day or night and have all weather capability. They can therefore penetrate clouds cover, fog, rain and atmospheric dust. Furthermore, radar energy has the ability to penetrate tree canopies and some surface features. This paper describes research to compare three different radar satellite imaging systems (ERS-1, JERS-1, and Radarsat) and three types of optical satellite data (Landsat TM, MSS and Spot XS) for detecting and monitoring mangrove deforestation in the delta of the Mahakam River on the coast of East Kalimantan.
2. Materials and Methods
2.1 Study Area
Because it is an archipelago, Indonesia has a large area of mangrove (4,250,000 ha are found around the four main islands). There are basically six categories of land use in the Indonesian mangrove areas: 1) forest reserves; 2) nature conservation; 3) protection forest; 4) production forest; 5) fish/shrimp ponds; and 6) salt production areas. Mangrove forests are traditionally a source of livelihood for the local population. The main problems of managing these resources therefore centre on delineating the area and resolving local community ownership issues.
In the study area, the delta of Mahakam River in East Kalimantan, the commercial production of shrimps for export was established in 1974. Every year, the company needs about 1,000,000 Kg of shrimps to reach their export target. For example, in 1996 it purchased about 1,015,000kg from local fishermen. At that time, shrimp ponds supplied about 4% of the demand, and fishermen operating at sea supplied most of the shrimps. The high demand for shrimps for export has resulted in substantial price increases. In 1997, the price of good quality of shrimps was about Rp50,000, or about US$15 per kilogram. This has encouraged local fishermen to build large areas of shrimp ponds. During the 1990s, they encroached into the mangrove forest, clear-cut the mangrove vegetation by slash and burn and then constructed dykes to surround the ponds. This activity tends to be concentrated in the areas covered by Nypa palm forest The system of production in the Mahakam delta is extensive. For example, the fishermen do not use water mills for oxygen circulation in the ponds but, instead, rely on the current flowing between high and low tides, large areas are required for extensive production. As a result, the ponds produce only about 2-3 tons per hectare. This is low compared with the 10 tons per hectare produced from shrimp ponds on the northern coast of Java. Because intensive production systems are expensive, the local fishermen assume that sufficient mangrove forest will remain to allow the establishment of large areas of ponds.
2.2 Remote sensing data
Data acquired by both passive and active remote sensing systems were used in the study. The specifications are summarized in Table 1.
| Image | Date of acquisition |
Wavelength | Spatial resolution | Polarization | Incidence angle |
| Landsat MSS | 15-04-1983 | 1) 0.5 - 0.6mm 2) 0.6 - 0.7mm 3) 0.7 - 0.1mm 4) 0.8 - 1.1mm |
70 m | - | - |
| SPOT-XS | 21-02-1987 | 1) 0.50-0.59mm 2) 0.61-0.68mm 3) 0.79-0.89mm |
20 m | - | - |
| Landsat TM | 1994 | 1) 0.52-0.60mm 2) 0.76-0.90mm 3) 1.55-1.75mm |
30 m | - | - |
| JERS-1 | 19-09-1996 | 1) 23.5 cm | 12.5 m | HH | 35° |
| ERS-1 | 28-05-1996 | 1) 5.6 cm | 12.5 m | VV | 23° |
| Radarsat-1 | 1-10-1997 | 1) 5.6 cm | 12.5 m | HH | 40° |
2.3 Method
The research involved two main steps. In the first step, a broad classification of the general land cover, including mangroves was made (Figure1). This indicated the best approach to dealing with the various types of imagery in order to detect the mangrove deforestation. The second step concentrated on the specific problem of detecting changes in the mangrove areas (Figure2). It examined different approaches for monitoring the nature of the changes in order to produce maps showing the current and former conditions in the study area.
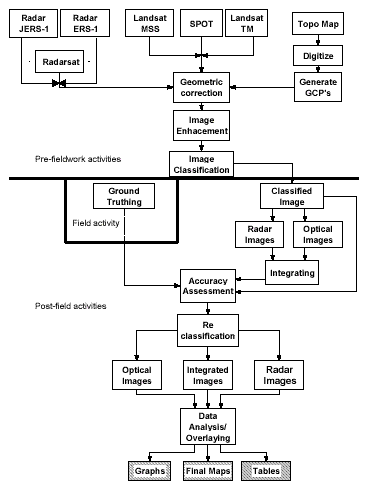
Figure 1. Method
3. Results and Discussions
The classes identified on each image using supervised classification are summarized in Table 2..
classification and visual interpretation
| Landsat MSS | SPOT | Landsat TM | ERS-1 | JERS-1 | Radarsat |
| Broad-leaved Nypa Water Ponds - - agriculture - - - - |
Broad-leaved nypa water dry pond orchard mixed agriculture - - - - |
broad-leaved nypa water fish pond orchard mixed agriculture clear-cut half-cut swampy - |
- nypa water fish pond - mixed - clear cut - - oil pipeline |
- nypa water fish pond - mixed - clear-cut half-cut - oil pipeline |
- nypa water fish pond - mixed - clear-cut half-cut oil pipeline |
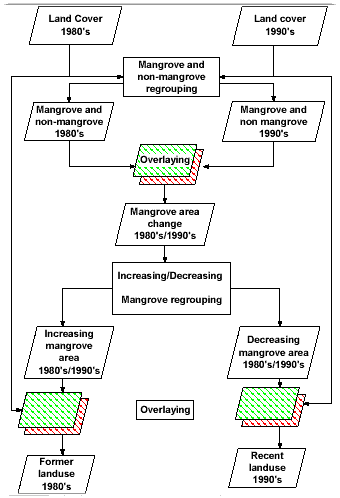
Figure 2. Mangrove forest area change detection procedure
Three types of mangrove deforestation were found to occur in the study area:
- deforestation caused by the establishment of agriculture and/or orchards;
- deforestation caused by the establishment of oil pipeline networks;
- deforestation caused by the establishment of shrimp ponds.
The accuracy of each classification was assessed by comparison with data collected at sample points on the ground and compiling error matrices. Based on data collected at sample sites in the field, the classification accuracy of each image to detect deforested mangrove area was as follows:
| Landsat MSS | 1982 | 5 classes | 76% |
| SPOT_XS | 1987 | 7 classes | 89% |
| Landsat TM | 1994 | 9 classes | 88% |
| ERS | 1996 | 6 classes | 83% |
| JERS | 1996 | 7 classes | 85% |
| Radarsat | 1997 | 7 classes | 84%v |
3.1 Mangrove land use changes
For the purpose of detecting the mangrove land use a broad classification (mangrove forest, non-mangrove forest and water bodies) was first made for each image. This was used to avoid possible problems that might occur if a detailed classification with many classes was used. The result of the change detection analysis generated from Landsat MSS 1982, Landsat TM 1994, and fused images (Landsat TM 1994 and ERS-1 1996 radar data) are summarized in Table 3. The accuracy assessment of these various classifications is shown in Figure 3.
The mangrove forest area was seriously reduced from 1994 to 1996 in comparison with the period of 1982 to 1994. From Table 3 it may be concluded that the evolution of mangrove areas was as follows: 96,228 ha, 91,827 ha, and 78,799 ha in 1982, 1994 and 1996 respectively. The trends of these changes in mangrove area are indicated in Figure 4. From these results, it appears that about 13,028 ha (14.2% of the mangrove areas in 1994) disappeared in the period of 1994 to 1996, whereas only about 4,401 ha (4.6% of the 1982 area) disappeared in period of 1982 to 1994. The total of mangrove areas that disappeared in between 1982 to 1996 is about 17,429 ha (18.1% since 1982). Therefore, it may be concluded that the mangrove forest area has predominantly deteriorated between period of 1994 to 1996.
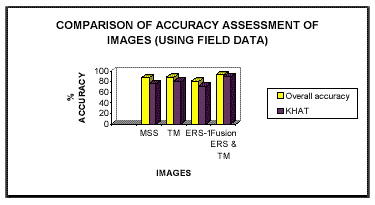
Figure 3. Accuracy of the broad classification
used for the change detection analysis
Table 3. Delta Mahakam mangrove forest
land cover in 1982 to 1996
| Class Category | MSS data in 1982 (ha) |
TM data in 1994 (ha) |
Fused image of TM 1994 and ERS-1 1996 (ha) |
| *. Mangrove *. Non mangrove *. Water bodies |
96,228 16,164 99,398 |
91,827 12,602 107,361 |
78,799 24,751 108,240 |
| Total | 211,790 | 211,790 | 211,790 |
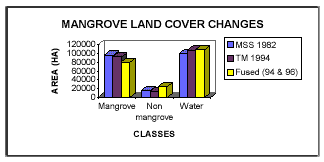
Figure 4. Mangrove land cover changes between 1982 to 1996
From the field data collection at the study area it was found that most of the deforested areas were converted to fish and shrimp pond establishment. This evidence was supported by the images classification result in which there are increasing in water bodies during the period of 1982 to 1996.
4. Conclusions
4.1 Detecting mangrove deforestation
Results of this research show that it is possible to differentiate between mangrove forest and non-mangrove cover types with all types of optical remotely sensed data. Specifically, it was found that:
- all optical data were able to differentiate fishponds;
- Landsat MSS and Spot XS data were able to differentiate only one agriculture class;
- Landsat TM data was able to differentiate two agriculture classes;
- none of the optical data were able to differentiate oil pipeline establishment.
- all radar data were able to differentiate fishponds and clear cut areas;
- all radar data were able to identify the establishment of oil pipelines (using both spatial and backscatter information)
- none of the radar data were able to differentiate any agriculture classes
- JERS-1 and Radarsat images were able to differentiate partly cut Nypa palm (fishponds under construction).
4.2 Monitoring mangrove deforestation
Results of this research show that it is possible to monitor mangrove deforestation with a reasonable accuracy using optical and radar satellite images.
- during period of 1982 to 1996 about 17,429 ha of mangrove forest disappeared and changed to another land uses;
- mangroves deforestation in study area is mainly caused by shrimp ponds establishment;