| GISdevelopment.net ---> AARS ---> ACRS 1999 ---> Poster Session 5 |
The Research on the Land
cover and Vegetation Degradation Rate In the Karst Area using Remote
Sensing
Yang Shengtian, Zhu
qijiang
The Center for RS & GIS, Beijing Normal University 100875
The Center for RS & GIS, Beijing Normal University 100875
Karst, 20 millions km2 in the world, occupies 12
percent of land in the globe. In china, based upon the distribution of
Carbonate Rock, the karst area reaches 3.4 millions km2, according to the
revealing area of Carbonate Rock, it is 0.9 million km2. Especially two
regions of Karst Environment that that locate in Sanxi Province and nearby
provinces, and in the west-south part of China including Guizhou, Yunnan
and Hubei provinces are the widest karst area in the world. So the Karst
environment plays an important role on the aspect of development of
economy, society and so on in the world and China. For these reasons, many
scientists have been focusing on the problems in the Karst environment.
H.E. Legard brought forward the ecological problems on the karst
environment in 1973; the karst environment formally was regarded as one of
the weakest environment in the 149th advance conference in U.S. in 1983.
Chinese geologists and geographers have also been concentrating on
studying the change of the Karst environment since 1949. In particular,
many institutes and university such as Gechmistry institute, Chinese
Academy of Geology; NanJing University and Guizhou Normal University have
got achievements on the fields of the relationship between human beings
and nature, the changes of Karst environment quality, physiognomy
generation in the karst environment, etc. However, an important question-
the rate of degradation in the Karst environment-has stillnot been
answered satisfactorily. Therefore, in the article, Remote Sensing was
applied to study the changes of the Land cover and the Vegetation in the
Karst area in order to solve in certain extent the degradation of the
Karst environment which is useful to the Karst environment science and the
development of society and economy in the Karst regions.
For studing the change rate of the Land cover and the Vegetation in the Karst area, we set a study area in the ma mountains, ZhiYun district, GuiZhou Province, China. The study area is 12km* rectangle; its latitude is about 25o34'41" and its longitude is about 106o18'39", its height is 1100 m altitude. The natural properties are that its rock is Carbonate; its physiognomy is ridges and peaks; it is in the area of middle subtropical class; its vegetation belongs to the class of regrowth forest and shrub in the middle subtropical climate. The average income for people in the study area is lower than 200 Yuan per year; the average food for people is lower than 300 Kg per year; so it is one of the poorest region in China. According to the situation of the land use, vegetation and habitat distribution, the study area was divided into three regions: the human being activity region, the nature- human being intergrade region and the natural domination region. The imagery of study area and its three regions are shown in figure 1.
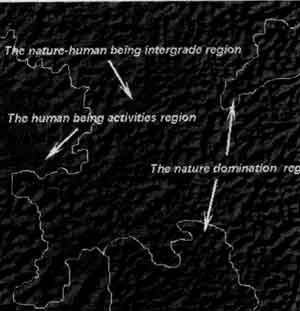
Figure 1 The images of the study area and its regions
The research on the land cover change
The method of studying the land cover change
The imageries of Landsat MSS in 1973, TM in 1990 and TM in 1995 were chosen to classify the land cover and the result of classification was analyzed for purpose of recognizing the change of land cover in karst area. The steps were as fellows:
The pixel statistics about every class on the basis of the map of land cover classification was shown as table 1. The data in the table 1 suggested:
Table 1 the pixel statistics about every class on the basis of the map of land cover classification
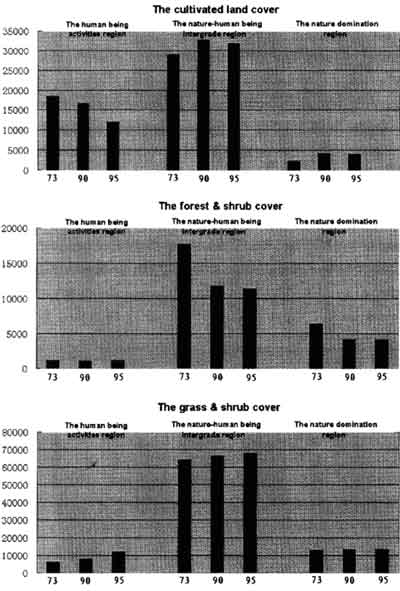
Figure 3 The pixel statistics of every class in three regions
The research on the vegetation change
The method of study the vegetation change
In the order to actually recognizing the vegetation change, the TM imagery data, which were at the same time of October end in 1994 and 1995, were chosen to calculate their NDVI. The steps were as fellows:
The pixel statistic of NDVI changes caused by vegetation degradation was shown in table 4.
Table 2. The pixel statistic of NDVI change
The table 4 suggested that: There were 1.63 percent area in which the vegetation was lower than in last year. The high NDVI change in the nature-human being integrade region and nature domination region expressed that the better Karst environment is still the goal region of human being exploiting.
The conclusions
According to the analysis and results above, there are the conclusions as fellows:
Acknowledges
The research was funded by the national science foundation of China (49761003) and the science foundation of GuiZhou Province, China (98-3061)
References
For studing the change rate of the Land cover and the Vegetation in the Karst area, we set a study area in the ma mountains, ZhiYun district, GuiZhou Province, China. The study area is 12km* rectangle; its latitude is about 25o34'41" and its longitude is about 106o18'39", its height is 1100 m altitude. The natural properties are that its rock is Carbonate; its physiognomy is ridges and peaks; it is in the area of middle subtropical class; its vegetation belongs to the class of regrowth forest and shrub in the middle subtropical climate. The average income for people in the study area is lower than 200 Yuan per year; the average food for people is lower than 300 Kg per year; so it is one of the poorest region in China. According to the situation of the land use, vegetation and habitat distribution, the study area was divided into three regions: the human being activity region, the nature- human being intergrade region and the natural domination region. The imagery of study area and its three regions are shown in figure 1.
Figure 1 The images of the study area and its regions
The research on the land cover change
The method of studying the land cover change
The imageries of Landsat MSS in 1973, TM in 1990 and TM in 1995 were chosen to classify the land cover and the result of classification was analyzed for purpose of recognizing the change of land cover in karst area. The steps were as fellows:
- The TM imagery in 1995 was geometrically registered to the relief
map
- Taking register TM imagery in 1995 as basis imagery, matching TM
imagery in 1990 to it. After resampling the MSS imagery in 1973 to make
its resolution reach 30*30 m, matching it to registered TM imagery in
1995.
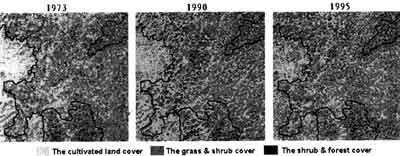
Figure 2 the maps of the land cover classification in 1973, 1990 and 1995
- In order to minimize the different radiometric properties caused by
season which could affect on the classification, the training sites were
chosen at the same spatial position where there were the same land cover
class in different year. The classes of training sites included: the
cultivated land class; the grass and shrub class; the forest and shrub
class. Every class of traing sites was divided to subclass according to
shadow, different region.
- Respectively applying maximum lkehood classification to classify the
Remote Sensing data in 1973, 1990 and 1995. After sieving and combining
the classes, the map of land cover class was got.
- Checking the result of classification in 1995 with Surveying the land cover in the study area. The precision was estimated above 90%, so the classification method was reliable. The results were shown as figure 2.
The pixel statistics about every class on the basis of the map of land cover classification was shown as table 1. The data in the table 1 suggested:
Table 1 the pixel statistics about every class on the basis of the map of land cover classification
| The cultivated land cover(pixel) | The forest & shrub cover (pixel) | The grass & shrub cover (pixel) | |
| 1973 | 49877 | 25314 | 83633 |
| 1990 | 53852 | 17085 | 87860 |
| 1995 | 47901 | 16677 | 93600 |
- The pixel number of forest and shrub class in the study area tended
to become little. The decreased pixel number of the forest and shrub
class from 1973 to 1990 was 8229, which decreased 32.5% comparing with
the situation in 1973. Its degradation rate of was 1.9% per year. The
decreased pixel number from 1990 to 1995 was 408, which decreased 2.4%
comparing with the situation in 1990. Its degradation rate of was 0.48%
per year. These results showed that the degradation of forest and shrub
class hs been existing in the Karst environment recent years, but after
1990's, its degradation rate of starts to reduce because of executing
measurements of natural conservation.
- The pixel number of cultivated land class in the study area had
increased and decreasing trend. The pixel number of cultivated land
class from 1973 to 1990 increased 3975, which was 7.9 percent of pixel
number of cultivated land cover in 1973. Its increasing rate was 0.46%
per year. The cultivated land class pixel, however, from 1990 to 1995
decreased 5952 pixels, which was 11.1 percent of the number of
cultivated land cover pixel in 1990. Its decreased rate during these
11.1 percent of the number of cultivated land cover pixel in 1990. Its
decreased rate during these years was 2.2% per year. These results
showed that the cultivated land area was increased during 1970's and
1980's because of human being reclaiming wasteland and the cultivated
land area was decreased during 1990's for the reasons of executing the
policy of natural conservation and exchanging cultivated land to
forest.
- The pixel number of shrub and grass class in the study area was increased. The pixel number of the shrub and grass class from 1973 to 1990 increased 4227, which was 5.1 percent of pixel number in 1973. The increasing rate was 0.3% per year. The increasing pixels from 1990 to 1995 was 5740, which was 0.3% per year. The increasing pixels from 1990 to 1995 was 5740, which was 6.5 percent of the pixel number in 1990. The increasing rate of the shrub and grass class was 1.3% per year. These results showed the shrub and grass class was in the increasing trend. Actually, the increasing trend of the shrub and grass class is the result of the Karst environment degradation and the environmental conservation. The forest and shrub class is degraded to the shrub and grass class and the cultivated land cover is also developed to the shrub and grass class for the reason of sending cultivated land back to forest. Therefore, it was recognized that the increasing trend from 1973 to 1990 was relate with the forest and grass cover degradation in some extent and the increasing trend from 1990 to 1995 was relate with the measurement of exchanging cultivated land back to forest in some extent.
Figure 3 The pixel statistics of every class in three regions
The research on the vegetation change
The method of study the vegetation change
In the order to actually recognizing the vegetation change, the TM imagery data, which were at the same time of October end in 1994 and 1995, were chosen to calculate their NDVI. The steps were as fellows:
- Respectively standardizating the TM data in 1994 and 1995 to make
them have the same mean and Stdev. The formulate was:

Xij is actual data. Xij is the mean of j sample. ¶j is the Stdev of j sample. After standardization, the mean of TM data in 1994 or 1995 is 1 and their Stdev is 0.
- Taking the histogram of TM3 band and TM4 band in 1995 as basis,
respectively matching the histogram of TM3 and TM4 band in 1994 to
them.
- Calculating the NDVI in 1994 and 1995
- The NDVI in 1995 minus the NDVI in 1994 was the changed message M.
Through analyzing the changed message M, it was found that it mainly
indicated the message of shadow. So the actual NDVI changed message AM
which really showed the change of vegetation was obtained when filtering
the message of shadow from changed message M.
- Checking the results with survey in the study area It was found the
most of messages AM indicated the forest or shrub destroyed and some
message AM indicated the changes of crops, so the message AM expressing
the changes of corps must was eliminated with the manual method. The
final result of changed NDVI was shown in figure 5.
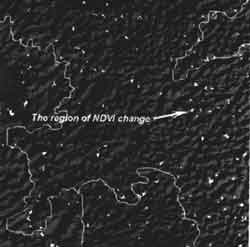
Figure 4 The imagery of the NDVI change region
The pixel statistic of NDVI changes caused by vegetation degradation was shown in table 4.
Table 2. The pixel statistic of NDVI change
| The changed pixel | The total pixel | The changed pixel percentage | |
| The human being activities region | 184 | 17515 | 1.05 % |
| The nature-human being intergrade region | 1060 | 60109 | 1.76 % |
| The nature domination region | 170 | 9002 | 1.88 % |
| Total | 1414 | 86626 | 1.63 % |
The table 4 suggested that: There were 1.63 percent area in which the vegetation was lower than in last year. The high NDVI change in the nature-human being integrade region and nature domination region expressed that the better Karst environment is still the goal region of human being exploiting.
The conclusions
According to the analysis and results above, there are the conclusions as fellows:
- The method of the land cover classification and calculating NDVI
using Remote Sensing data and analyzing their results are successful in
obtaining the change message of land cover and vegetation degradation in
Karst environement.
- Nowadays the degradation of the karst environment still exist
because of human being activities, it is estimated that there is 1.63%
area showing the vegetation degradation. Especially in the better
quality of Karst area, the affection of human being exploitation is
evidently revealed. It makes the degradation rate of vegetation cover
reach 1.88%.
- The area of the forest and shrub cover is the main object of human
being cultivating because of it environmental quality. Therefore many
policies on environment conservation are recently executed and the
degradationrate has been lower than 1.9% before, but it is estimated
that there is still 0.48% the forest and shrub degradated per
year.
Acknowledges
The research was funded by the national science foundation of China (49761003) and the science foundation of GuiZhou Province, China (98-3061)
References
- Yuan daosian, Karst Science in China, the geological publishing
house, 1993
- Yang shengtian, The study of sustainable development in Rock
mountain, GuiZhou, Guizhou environment, 1994; 4:1~6
- yang mingde, The research on the relationship between the economic
development and the Karst environment in GuiZhou Province, Guizhou
publishing house, 1988
- Chao junming, the statistics of geography, Beijing Normal University publishing house, 1995