| GISdevelopment.net ---> AARS ---> ACRS 1999 ---> Poster Session 5 |
An Empirical Investigation of
the Thematic Accuracy of Land Cover Classification Using Fused Images
Waileung Lau, Bruce A.
King, Zhilin Li
Department of Land Surveying and Geo-Informatics
The Hong Kong Polytechnic University
Hung Hom, Kowloon,
Hong Kong
Tel: +852-27665976 Fax: +852-23302994
Email: 97980389r@polyu.edu.hk, http://www.gisdevelopment.net/aars/acrs/1999/ps5/lsbaking@polyu.edu.hk, http://www.gisdevelopment.net/aars/acrs/1999/ps5/lszlli@polyu.edu.hk
Abstract
Land cover classification is often accomplished with a single multispectral image. However, the informational utility of a multispectral image is limited by the spectral and spatial resolution of the imaging system. Current imaging systems somehow offer a trade off between high spatial and high spectral resolution - no existing single system can offer both of these characteristics. In order to achieve both high spatial and spectral resolution in a single image, image fusion may be employed. This paper examines the influences of image fusion on thematic accuracy of land cover classification through an example using SPOT panchromatic and multispectral images. Three fused images were generated using intensity-hue- saturation (IHS), principal component analysis (PCA) and high pass filter (HPF) fusion methods. All the images were then classified under the supervised classification approaches of maximum likelihood classifier (MLC) and neural network classifier (NNC). Using the classified result of the parent (original multispectral) image as a benchmark, the integrative analysis of the overall accuracy indicated a certain degree of improvement in the classification from using the fused images. The validity and limitations of image fusion for land cover classification are finally drawn.
1. Introduction
To achieve accurate classification, a spectral image with a larger number of narrow bandwidths spectral bands (high spectral resolution), is necessary. To gather image data with high spectral resolution, a sensor with large-sized instantaneous field of view (IFOV) is required to allow the necessary quantity of radiant energy to enter the detector elements. This results in a sensor with low spatial resolution. The opposite case occurs for high spatial resolution sensors. For example, an image coming from the spectrally oriented (seven-band) LandSat TM sensor has 30-meter resolution and the image from the spatially oriented (1-metre resolution) IKONOS-2 sensor is panchromatic. These fundamental sensor characteristics directly affect the thematic and spatial accuracy of classification of a single image. Multisensor fusion is a technique whereby single image that has the characteristics of both high spectral and spatial resolution sensors can be generated.
Previous researches in this arena concentrated on developing fusion algorithms and their assessment of its advantage was limited to visual enhancement. Experiments using the integrated information of fused images were seldom repeated. In particular, the effects of multisensor fusion in image classification have only been reported in Munechika et al (1993). Here, a pair of SPOT panchromatic and LandSat TM images was used in the fusion process. In testing the classification performance of the fused images, Gaussian maximum likelihood classification was executed for five types of land cover and evaluation consisted of comparison of the outcomes with ground truth data. The results indicated an enhanced accuracy of classification using the fused image over using the individual (parent) images. However, alternative types of images, fusion methods, levels of classification and classifiers were not evaluated.
This paper investigates the influences on classification of the multisensor fusion of (relatively) high spatial resolution SPOT panchromatic (PAN) and (relatively) high spectral resolution SPOT multispectral (XS) images. Three fusion approaches - intensity-hue-saturation (IHS), principal component analysis (PCA) and high pass filter (HPF) - were used to generate the fused images containing both high spatial and spectral resolutions for classification. The fused (child) images and the original multispectral (parent) image were classified under the supervised classification approaches of maximum likelihood and neural network classifiers. The classifications for USGS level-one natural land cover and level-two cultural land use were performed for multilevel-based analysis. Instead of visual inspection, the classification results with respect to the overall accuracy from the confusion matrices were assessed. Using the parent image as a benchmark, the influences of classification using the fused images were evaluated.
2. Experimental Testing
In this study, all the image processing operations (multisensor fusion and image classification) were carried out on a Digital Ultimate workstation model 533AU2 using PCI ImageWorks and Xpace version 6.01.
2.1 Test Data
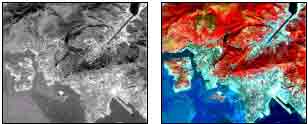
The experiment in this study used a pair of image: SPOT panchromatic (PAN) and multispectral (XS) images. The PAN image, was dated 92/01/31 and the XS 91/12/20. To reduce the image size to be manipulated and to maintain geographic consistency during fusion, equivalent sub-scenes as shown in Figures 1a (PAN) and 1b (XS) were defined.
 | |
| (a) | (b) |
Figure 1. Original image data: (a) SPOT PAN image; (b) SPOT XS image.
2.2 Fusion Processing
Ten stations of the local triangulation network (Hong Kong 80 Grid System) were selected as ground control points (GCPs) for geometric registration followed by the geo-locking of the XS image to the PAN image. After the “geometric locking” process, fusion of the images was performed by the three approaches, IHS, PCA and HPF.
The XS image was transformed into IHS and PC spaces, and the high spatial component (PAN image) replaced the intensity and first principal component respectively. The reverse function transformed the replaced and other components back into the RGB mode of the newly generated, fused XS image. For the HPF fusion, the spatial detail from panchromatic image (PAN) was extracted by differential high pass filtering and directly integrated into the XS image to form HPF-fused image. The three child images generated by IHS, PCA and HPF fusion process are shown in Figure 2.
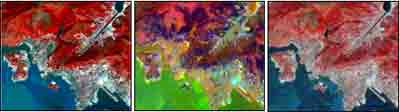 | ||
| (a) | (b) | (c) |
2.3 Training Stage for Classification The USGS classification systems for remote sensing (Anderson et al., 1972) was used to define the classification themes. Using Anderson’s classification system, four categories - water, vegetation, urban and barren land - were defined for level one classification. Another eight categories - sea, inland water, grassland, woodland, mixed urban area, transportation, sandy area and open space - were defined for level two classification. The descriptions of all categories are summarized in Table 1.
| CLASS | DESCRIPTION |
| LEVEL 1 | |
| WATER | Water coverage includes ocean, streams and reservoirs |
| VEG | Vegetated coverage includes woodland, grassland and swamp. |
| URBAN | Artificial coverage includes residential, commercial, industrial and transportation. |
| BARREN | Uncovered coverage include beach, rock outcrop and construction sites |
| LEVEL 2 | |
| SEA | Predominant and large bodies of water separate the land mass |
| INLAND | Water covered area within the land mass includes reservoirs, streams and estuaries. |
| GRASS | Shrub and brush covered area |
| WOOD | Forest covered area. |
| MXURBAN | Intensive built-up area includes residential, industrial and commercial zone. |
| TRANS | Linear routes as clearcuts and boundaries outline the other land use. |
| SANDY | Un-vegetated sands dunes dominated along the coast. |
| OPEN | Temporary barren land included construction sites and bare space. |
Due to the time difference bwteen imagery date and the date of this study, field verification of the classified images was invalid. Total reliance was made on the ancillary information sources for the ground reference data. Ancillary information used during training included a number of aerial photos (SMO, 1993 & 1994), Hong Kong land utilization map (SMO, 1988) and Hong Kong topographic maps (SMO 1990 & 1998).
In acquiring ground truth data, the size and delineated units were designed with reference to Congalton and Green (1999). For the sample size of training data, a minimum of 50 samples for each category was used. For each class, a stratified random sampling technique was used in capturing the location of each training set. The delineated locations were distributed over the entire image. Based on the ancillary information, more than 130 sites were delineated for each of the two classification cases. Two sets of data were identified for each class, one set was used for the classification training and the other to assess the thematic accuracy.
After the training process, all the child and parent multispectral images were classified into the two levels through three selected approaches.
2.4 Classification Results
Table 2 lists the overall accuracy and the percentage of correctly classified pixels in individual classes of the level one classification result using three child-images and parent spectral image. For the level two classification, a second, independent data sets was obtained for the training stage. The classification results are summarized in Table 3.
land cover classification results.
| Thematic Accuracy of Classification Results (%) | ||||
| Accuracy Assessment |
XS | IHS-fused | PCA-fused | HPF-fused |
| MLC | ||||
| WATER | 99.10 | 100.00 | 95.10 | 96.50 |
| VEG | 100.00 | 95.90 | 95.40 | 93.30 |
| URBAN | 92.90 | 88.80 | 86.30 | 76.10 |
| BARREN | 94.40 | 91.90 | 86.90 | 73.40 |
| Overall Accuracy | 93.45 | 91.66 | 88.78 | 80.51 |
| NNC | ||||
| WATER | 99.30 | 100.00 | 84.50 | 97.20 |
| VEG | 100.00 | 100.00 | 99.50 | 99.00 |
| URBAN | 96.70 | 83.00 | 88.50 | 94.10 |
| BARREN | 100.00 | 91.00 | 99.50 | 80.60 |
| Overall Accuracy | 98.05 | 88.85 | 91.66 | 92.83 |
Table 3. The thematic accuracy of cultural
land use classification results.
| Thematic Accuracy of Classification Results (%) | ||||
| Accuracy Assessment |
XS | IHS-fused | PCA-fused | HPF-fused |
| MLC | ||||
| SEA | 66.30 | 83.80 | 88.30 | 65.50 |
| INLAND | 92.00 | 73.60 | 74.70 | 85.10 |
| GRASS | 64.10 | 83.20 | 48.30 | 86.20 |
| WOOD | 64.40 | 72.60 | 56.40 | 79.50 |
| MXURBAN | 59.50 | 65.30 | 45.90 | 16.60 |
| TRANS | 37.90 | 29.20 | 45.10 | 35.10 |
| SANDY | 51.00 | 89.40 | 57.00 | 80.80 |
| OPEN | 79.20 | 59.50 | 30.90 | 83.50 |
| Overall Accuracy | 63.55 | 67.54 | 53.47 | 64.55 |
| NNC | ||||
| SEA | 53.30 | 35.80 | 51.50 | 35.80 |
| INLAND | 96.60 | 74.70 | 79.30 | 82.80 |
| GRASS | 95.30 | 81.90 | 57.40 | 55.40 |
| WOOD | 55.00 | 76.90 | 56.40 | 54.10 |
| MXURBAN | 82.50 | 56.20 | 48.90 | 28.40 |
| TRANS | 21.90 | 16.90 | 30.70 | 46.10 |
| SANDY | 85.40 | 98.70 | 91.40 | 86.80 |
| OPEN | 92.40 | 51.70 | 44.10 | 86.90 |
| Overall Accuracy | 69.82 | 56.25 | 51.89 | 56.12 |
3. Analysis of Experimental Results
In the level one classification (Table 2), the mean accuracy of the fused image was 7.0 percent less than the original XS. For some classes, such as URBAN and BARREN in MLC, the decreased classification accuracy was up to 21 percent. In NNC, the mean accuracy was degraded by about 7.1 percent with a maximum decrease of 19.4 percent. The degradation of accuracy is significant in classification using fused images. The spatial information obtained from the PAN image did not improve the accuracy of classification of the XS image by either the MLC or NNC approach. The reason of degraded accuracy may be came from the distorted spectral characteristics. By the visual inspection of the fused images, the spectral characteristics of the XS image were distorted after the multisensor fusion. For the homogenous natural land cover areas, which are recognized by the high purity of spectral characteristics, the fused images with changed characteristics are inappropriate for the classification.
In the level two MLC classification (Table 3), the higher overall accuracy of results using the IHS and HPF fused images over the parent spectral image were achieved by up to 4.0 and 1.0 percent respectively. The improvement of overall accuracy was significant (Table 3, MLC). For some classes, such as GRASS and SANDY, the enhanced accuracy of the IHS-fused image is up to 19.1 and 38.4 percent respectively. All the classes, except INLAND, showed the significantly enhancement in the accuracy of the classification of the fused images. However, the PCA-fused image, with a large degree of distorted spectral characteristics, produced a 10.1 percent degradation of the overall accuracy of classification. Certain improvements of accuracy in the PCA-fused image in some classes, such as SEA and TRANS, were achieved. The accuracy of other classes decreased, such as MXURBAN and OPEN classes (Table 3, MLC), the deterioration level being 13.6 and 48.3 percent respectively.
In the comparison of the parent spectral image in level two NNC classification, the overall accuracy of results of the three fused images decreased on average by 15.1 percent. For the some classes, such as MXURBAN, the accuracy of the fused images declined to 26.3, 33.6 and 54.1 percent respectively. The accuracy of spectral images were significantly degraded after the multisensor fusion. However, the individual accuracy of three classes were improved after using the fused images. For the classes of WOOD, TRANS and SANDY classes, the range of improvement was from 1.4 to 24.2 percent. In particular, the TRANS classes, the highest improvement level was achieved. As those improved classes were categorized by the sub-division of classification level, the intention of using fused spatial information to improve the level two classification accuracy can be upheld.
4. Conclusion and Discussion
Land cover classification works with the spectral information of an image. The presented fusion experiments showed that the spectral characteristics of a SPOT XS image were distorted after the fusion with a high-spatial resolution SPOT PAN image. This implies that the successful image fusion, which generates an image with both spatial and spectral resolutions, cannot avoid changing the spectral characteristics of the parent multispectral image. Since the purity of spectral characteristics was degraded after the fusion, the use of multisensor fusion is invalid to enhance the thematic accuracy in the case of the natural land cover classification, which requires greater quantity of spectral information than spatial details. In the level one classification results, the overall accuracy from two classifiers using the fused images deteriorated. For level two classification that requires more spatial details, the complicated patterns of features, multisensor fusion has potentials to improve the accuracy of results. The classification results of MLC demonstrated the improvement of thematic accuracy after using the multisensor fusion methods of IHS and HPF. In the NNC results, although the overall accuracy was decreased, the individual accuracy of some classes were enhanced. Among three selected fusion approaches, the IHS fusion approach for the level two classification produced higher accuracy results than the parent image. If higher level land cover classification is required from multispectral images, unless the image has high spatial resolution, multisensor fusion with an image of higher spatial resolution is recommended.
5. Acknowledgments
This study was funded by the Hong Kong Polytechnic University (project account code: 0350/797/A3/340).
References
- Anderson, J. R., E. E. Hardy and J. T. Roach (1972). “ A Land-Use Classification System for Use with Remote Sensor Data.” U. S. Geological Survey Circular, No. 671.
- Congalton, R. G. and K. Green (1999). Assessing the Accuracy of Remote Sensed Data: Principle and Practices. CRC Press, Inc., Denvers
- Munechika, C. K., J. S. Warnick, C. Salvaggio and J. R. Schott (1993). “Resolution Enhancement of Multispectral Image Data to Improve Classification Accuracy.” Photogrammetric Engineering & Remote Sensing, 59(1): 67-72.
- SMO (1988). Land Utilization Map in Hong Kong. Survey Mapping Office, Lands Department, Hong Kong Government.
- SMO (1990). Topographic Map in Hong Kong Island and Kowloon. Sheet 11, Survey Mapping Office, Hong Kong Government.
- SMO (1993). Aerial Photograph of Tsing Yi. No. CN 5409, Survey Mapping Office, Hong Kong Government.
- SMO (1994). Aerial Photograph of Hong Kong. No. CN 6099, Survey Mapping Office, Hong Kong Government.
- SMO (1998). Topographic Map in Hong Kong. Sheet 1& Sheet 2, Survey Mapping Office, Lands Department, Hong Kong Government.