| GISdevelopment.net ---> AARS ---> ACRS 1999 ---> Poster Session 5 |
Using Multi-temporal
Satellite Radar and Optical Remote Sensing Data Sets for an Integrated
Analysis of Oil and Gil Geology of Sedimentary Basins in Central China
Yu Wuyi
Research Institute of Petroleum Exploration and Development,
CNPC, China
Zhu Liangpu and Zhang Chen
Geology Department of Beijing University
AbstractResearch Institute of Petroleum Exploration and Development,
CNPC, China
Zhu Liangpu and Zhang Chen
Geology Department of Beijing University
This study is focused on oil and gas geology in an area of Central China. It demonstrates the integration of remote sensing as well as seismic profiling and extended aeromagnetic data in order to obtain a better and more comprehensive understanding of the three-dimensional structure of multi-layers from surface to basement. Te integrated remote sensing technique employs multi-sensor imagery, data an east-west trending fault-like lineament in the Cahoshui and Yabulai basins can be readily reconginzed on TM, SAR imagery and AVHRR imagery. We believe this feature to be a large-scale linear structure that has a strong control on the development of the basins. The interpretation of the remote sensing data also revealed a series of folds and circular features. The SAR and NOAA play an important role in the recognizing linear features. C-band synthetic aperture radar (SAR) were subjected to a 5x5 adaptive filtering process (Lee); the spatial resolution is relatively high, and there appears to be slight penetration of dry thin-bedded sandstone terrain features.
Introduction
The Mesozoic Chaoshui and Yabulai basins are located in the North of the Hexi Corridor in Gansu Province, Central China. It straddles across gains and lnner Mongolia, bounded in the Southwest by the Longshou Mountains and on the Northwest by the Yabulai Mountains. The hilly terrain in between the two basins is called Beidashan, which also border the Badanjilin and Tengeli desert areas. The two basins contain rare vegetation, and to a semi agriculture and pastoral semi-arid desert area. In order to obtain a better understanding of the regional oil & gas geology, we performed a remote sensing data analysis which consisted of the interpretation of multi-platform (Landsat, ERS-1 and NOAA), multi-band(visible light, thermal infrared and microwave) and multi-seasonal (all seasons, day and night) satellite imagery. The results provided structural geological information that was previously not available through conventional exploration techniques.
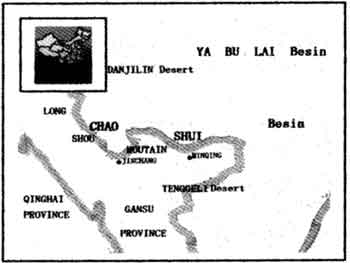
Figure 1: Location map of the area
New E-W Oriented Structure
Since the two basins are covered by loose, Aeolian desert sands, the controlling EW oriented faults on the development of the basins are partially masked, and their role in the structure setting is not easily recognized from the surface geological survey. With TM, SAR and NOAA image analysis, we obtained a completely new understanding of the EW oriented linear structures of the two basins. This enables us to delineate six structural belts and verify the relationship between the main faults and their importance to the development of the two Mesozoic sedimentary basins. In particular, SAR and NOAA images played a very important role. The 5x5 Lee-filtered ERS-1 C-band SR imagery has a relatively high spatial resolution of 25m and appears to have slight penetration of the dry material originating from thin-bedded sandstone (Fig.2). Analysis revealed the existence of the subsurface EW linear structures in the yabulai Yanchang and Saertai areas. These are interpreted as faults that have not been reported and documented in previous regional geology and petroleum geology reports and TM images. In the low resolution, multi-seasonal NOAA imagery (Band 4 and 5), a major linear feature covered by Tengeli desert can be observed in the southeast of the observed in the southeast of the Chaoshui basin. We interpret this as a fault caused by moisture differences. Due to blocking by the fault, the water table in the area to the North of the fault is shallow, resulting somewhat higher soil moisture which is detected in the NOAA thermal infrared image. Also, there is a relatively high geothermal, light color anomalous display (Fig.3).
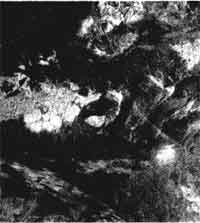
Figure 2: ERS-1 C-band SAR
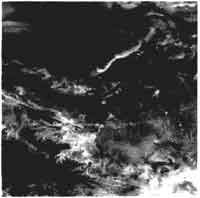
Figure 3: NOAA CH% 97/11/17
Integrated Oil & Gas Geology Analysis Using Remote Sensing, Seismic and Aeromagnetic Data
We improved our understanding of the regional oil & gas geology through the analysis of TM, SAR and NOAA mosaic images by correlating and integrating the results with those obtained from seismic profiling and extended aeromagnetic data as well as surface geological survey results.
- Data correlation and integrated analyzing and previous research in the Chaoshui and Yabulai basins were formed under the conrol of a series of NW and NE faults. Furthermore, our study indicates that the E-2 striking faults also controlled the formation of the basins and that different sections of the basins were controlled by different groups of regional faults.
- The sedimentary thickness and depocenter of the Jurasic and Cretaceous in the Chaoshui Basin are closely related to the differential movement among the fault blocks of the basin, while those in the Yabulai Basin are related to the tilting of the ridge basement in different stages.
- Interpretation of the structure traps is a very important task in the study of basin oil & gas geology.
- Using TM and SAR image mosaics, we have documented folds in the
Mesozoic sediments in the Southeast of the Badanjilin desert where the
burial depth is not very large. These folds have never been identified
on the 1:200,000 regional geological map. In the Yabulai-Yanchang area,
at southeastern end of the Yabuali - Yanchang area, at southeastern end
of the Yabulai basin, the TM and SAR image mosaics show a NE oriented
chain of circular structures. These features have been revealed for the
first time with the help of remote sensing data (Fig.4).
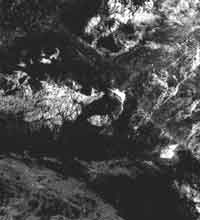
Figure 4: SAR + TM741
- By using remote sensing and seismic data, an N-S oriented fold and circular structure belt was identified. This belt is running through the two basins, and, based of integrated remote sensing analysis, it bears most promising potential for oil and gas.
Analysis of the Chaoshui and Yabulai basin data sets demonstrates that the application of the multi-platform, multiband and multi-time remote sensing is a viable approach to obtain useful information for oil and gas exploration in Central China. The results can be improved further with the integration of surface geology, geophysical and geochemical data. TM and NOAA multi-band remote sensing data provide useful geological information in the visible, near-infrared and far-infrared portions of the electro-magnetic spectrum, while the ERS-1 SAR data provide additional spatial information of the geological objects under study. It should be stressed that although the Chaoshui and Yabulai basins are located in a semi-desert area, mostly cover by sands, the penetration capability of the microwave into thin, dry sand sheets may disclose geological structure, such as faults and intrusive bodies, in residual basement hills. These features often elude surface geological surveys.
Multi-platform imaging provides image data from the study area with multiple surface resolution. The SAR with a spatial resolution of 25m and its steep, terrain, enhancing viewing geometry facilitates the interpretation of the micro-drainage and micro-structural bopography. The interactive relations between the NW and approximately E-W fault groups in the Longshoushan mountain were shown very clear in the local and regional SAR coverage.
The NOAA AVHRR data not only provided geothermal data from the geological objects, but also displayed some regional geological structures at its low resolution of 1.1 km. The NW striking subsurface fault in the Northwest of the Chaoshui Basin and the approximately EW striking regional fault in the East of the basin are both very clear in the NOAA image because of the thermal difference between the two sides of the fault.
Conclusion
In the oil & gas geological study of the Chaoshui and the Yabulai Basin, the following techniques were applied : (1) multi-band remote sensing for acquiring structure information on the oil and gas geology of the two basins; (2) satellite image analysis of data with different spatial and temporal resolution for discerning some important structure and details associated with the regional oil and gas geology; (3) analysis of TM image mosaic for the geological and structure features of the entire basin; (4) analysis of high-resolution satellite SAR images of key areas with shallow subsurface or some-subsurface structures; (4) integration of seismic profiles and extended aeromagnetic data for disclosing deep and basement features. In the study of the Chaoshui and the Yabulai Basin, various remote sensing data with different advantages were successfully applied. This enabled us to effectively solve the problems arising from geological interpretation of the essentially two-dimensional satellite remote sensing data. The integration of seismic and aeromagnetic data made it possible to establish an integrated 3D-basin petroleum geological model with information from multiple horizons including surface, shallow, deep and basement. This approach is a new and more comprehensive attempt to apply remote sensing in petroleum exploration. It has led us to new results and a better understanding of the regional geological structure.