| GISdevelopment.net ---> AARS ---> ACRS 1999 ---> Poster Session 5 |
Evaportranspiration Estimates
from fine-resolution NDVI
Susumu Ogawa, Takuhiko
Murakami, Naoki Ishitsuka, and Genya Saito (Japan)
National Institute of Agro-Environmental Sciences
3-1-1 kannondai, Tsukuba, Ibaraki 305-8604 Japan
Phone : +81-298-38-8192; Fax: +81-298-38-8199
E-mail: remote@niaes.affrc.go.jp
Abstract
National Institute of Agro-Environmental Sciences
3-1-1 kannondai, Tsukuba, Ibaraki 305-8604 Japan
Phone : +81-298-38-8192; Fax: +81-298-38-8199
E-mail: remote@niaes.affrc.go.jp
Evaportranspiration each land cover was estimated from vegetation index, NDIV. Water budget method and Penman formula lead to the daily evaportranspiration from watershed while the satellite data, SPOT, gave NDVI each land cover. Then, their correlation gave the regression lines each land cover. On the other hand, the time series of NDVI each land cover except water surface the other hand, the time series of NDVI each land cover except water surface changes seasonally and fitted very well with logistic urves for less than 300 Julian day. Especially, the time series of NDVI for forest and grass also fitted very well with the logistic curves modified with seasonal periodicity (r2=0.997 and 0.971, respectively). Moreover, NDVI for forest gave good agreement with the time series of air temperature. Using these regression curves for NDVI, the temporal and spatial distributions of evapotranspiration from watershed can be estimated.
1.Introduction
Water budget analysis has been required for forest and agricultural fields from the viewpoint of global environment. Especially, evaportranspiration from vegetationdeermines water cycle and affects on not only agricultural production but also natural disasters. Traditionally evaportranspiration has been calculated with water budget method, meteorological approach (Brutsaert, 1982), and vegetation index in satellite data (Running and Nemani, 1988). In this study, from vegetation index in satellite data, the spatial distributions and time series of evaportranspiration each land cover were estimated from Tade river watershed in the Saga Plains. First, annual evaportranspiration for Tade river watershed was calculated with water budget method, while daily evaportranspiration each land cover was obtained with Penman formula (Brutsaert, 1982). Both the results lead to daily evaportranspiration each land cover. Second, vegetationindex, NDVI, each land cover was obtained from satellite data, and combined with the corresponding daily evaportranspiration by linear regression, with which the spatial distributions of evaportranspiration are calculated. Third, in order to obtain the time series of evaportranspiration each land cover, the seasonal fluctuation of NDVI was expressed with logistic curves from SPOT data in 1997. Moreover, fluctuation of NDVI was expressed with logistic curves from SPOT data in 1997. Moreover, the correlation between NDVI and meteorological data was calculated, which showed NDVI correlates with air temperature very well. With the results, the interpolation for time series of NDVI was obtained and the seasonal fluctuation for evaportranspiration was estimated. Therefore, using the above methods, the spatial distributions and time series of evaportranspiration can be estimated from satellite data.
2.Material and Methods
2.1 Data used
For calculation, we used hydrological data (precipitation and discharge), meteorological data (air temperature, humidity, surface temperature, wind speed, short-wave radiation), multi-temporal SPOT data (Table 1), and digital elevation maps with 1:25,000 scale and 50-m spatial resolution. The satellite data were used for mainly land cover classification and NDVI calculation.
| Satellite | Date |
| SPOT | 1997/01/17,03/05,05/27,06/17,07/23,09/13,12/05 |
2.2 Observation Sites
A discharge observation site locates at Hiromaru Bridge over Trade River (catchment area: 28.37 km2) and a rainfall observation site locates at Saga Local Meteorological Station. Another observation site is at Agricultural Research Center of Saga Prefecture.
2.3 Water Budget Method
For long term observation, evaportranspiration was obtained from rainfall and discharge for the catchment. Water budget is given by
E = aEp (2)
Q = kSp (3)
where S is the catchment storage, t time, P precipitation, Q discharge, E evaportranspiration, a a coefficient (<1), Ep potential evaporation, k a coefficient, and p the exponent.
2.4 Penman Method
Daily evaportranspiration each land cover can be calculated from meteorological data with penman formula defined as (Brutsaert, 1982)
| E = | D --------- D + g |
Qn + | g --------- D + g |
f(u)(ea-ea) (4) |
Qn = Rn/Ll (5)
Rn = Rs(1-as) +esRld -Rlu (6)
Rld = easTa4 (7)
ea = 1.24(ea/Ta)1/7 (8)
Rlu = essTs4 (9)
Where D = (de*/dT)T, y =cpP/el, Qn is the available energy flux density in mm/day, f(u) the wind function in mm/day, u the mean wind speed in m/sec, ea* the saturation vapor pressure in hpa,ea the vapor pressure in hPa, Rn the net radiationin W/m2, Ll the latent heat of vaporization (=2.454 x 10⁶ J/kg), Rs the short-wave radiationin W/m2,, as the albedo of the surface, Rld the downward long-wave radiation in W/m2, Rlu the upward long-wave radiation in W/m2, es the emissivity of the surface m(=0.97), ea the atmospheric emissivity, s the Stefan-Boltzmann constant (5.67 x 10⁻⁸ Wm-2K-4), Ta the air temperature in K, and Ts is the surface temperature in K.
2.5 Vegetation Index and Evapotranspiration
Vegetatin Index, NDVI, relates with the biomass and correlates with evaportranspiration (Nemani and Running, 1989; shin and Sawamoto, 1996; Sqwamoto and Shin, 1997). NDVI is defined as (Rouse et al., 1973; 1974)
| NDVI = | IR - R ---------- IR + R |
(10) |
Where IR is the infrared pixel value and R is the red pixel value.
Here, since evaportranspiration for vegetation depends on leaf area index (LAI), the air temperature, and precipitation, the next equation may be assumed.
Where Tp is the transpiration, LAI the leaf area index, and f(T,P) a function of T and P.LAI is expressed by (Running and Nemani, 1988)
Where a and k are constants.
On the other hand, relationship between evaportranspiration and transpiration is given by (Campbell, 1985)
Thus, from Eq. (11), (12), and (13), the evaportranspiration can be expressed with NDVI as
Where b is a constant
Therefore, the evaportranspiration increase exponentially with NDVI. However, as it increase almost lineally with NDVI within a certain range, the next linear regression was applied for this study.
Where a and b are constants.
2.6 Evaportranspiration Estimates
Annually evaportranspiration is calculated from precipitation and discharge each catchment with water budget method as mentioned above. The separation of watershed and the calculation of its area were derived from the digital elevation maps. Next, the land cover classification was carried out from SPOT data with cluster classification method and the spatial distribution of NDVI was calculated each land cover as well. At the same time, daily evaportranspiration was obtained from the meteorological data with Penmna method, modified by the result of annual evaportranspiration, and finally determined as actual values.
3. Results and Discussion
3.1 Evaportranspiration
In land cover classification, six kinds of land covers were determined as Table 2. Daily evaportranspiration each land cover was calculated with Penmna method and the annual evaportranspiration was obtained from the daily data in Table 3. Another annual evaportranspiration was calculated with water budget method as well in Table 4. The annual evaportranspiration of this watershed with more than 80% of the area occupied with forest showed 600-700 mm by water budget method and 700-1000 mm by Penman method, which overestimated the annual values for the former. The fluctuation pattern for the precipitation of the watershed was similar to that of the evaportranspiration. The result of Penmna method was though to be almost the same to the observationof pan evaporation. The time series of evaportranspiration each land cover shows the difference of 30% between water surface and bare soils or urban areas, which are the maximum and the minimum, and the similar temporal patterns among them. Finally, daily evaportranspiration each land cover was determined with the result of water budget method. Figure 1 illustrates the time series of NDVI in Trade River watershed, which includes different patterns each land cover. This result is contrary to that of the evaportranspiration, the temporal patterns of which are similar among different land covers. As shown in Eq. 914), evaportranspiration is the exponential function of NDVI or the linear to NDVI within a certain range. Therefore, the time series of evaportranspiration should be reflected by the temporal fluctuation of NDVI. Furthermore, since evaportranspiration depends on precipitation and air temperature strongly as well as land covers, the evaportranspiration may be the function of NDVI, precipitation, and air temperature as Eq. (14).
| Catchment | Forest | Paddy | Urban | Grass | Bare Soil | Water |
| Tade (1993) | 81.0 | 15.2 | 1.4 | 1.3 | 0.6 | 0.5 |
| Year | Forest | Paddy | Urban | Grass | Bare soil | Water | Total |
| 1993 | 784.9 | 775.6 | 587.5 | 713.2 | 589.5 | 827.4 | 778.9 |
| 1997 | 1038.9 | 1008.4 | 813.7 | 958.4 | 816.4 | 1087.7 | 1029.1 |
| Year | Precipitation(mm/y) | Discharge(mm/y) | Evaportranspiration(mm/y) |
| 1993 | 2566.5 | 1852.3 | 714.2 |
| 1997 | 2352.0 | 1697.4 | 654.6 |
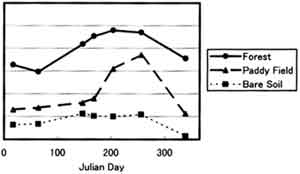
Figure 1. NDVI in Tade River watershed in 1997
3.2 Time Series of NDVI
Apparently, the steady land cover in time such as forest and the unsteady land cover such as agricultural fields should be separated in analysis for the time series of NDVI. The NDVI of forest fluctuates in time with daily air temperature. The correlation between the NDVI and air temperature yielded the next equation.
Therefore, the air temperature may be applied for the interpolation of NDVI for forest through the year.
On the other hand, the agriculture field such as a paddy field changes from grass to bare soils, water surface, crops and bare soils seasonally within three to five months. Especially in double cropping, land covers change through the year. NDVI for paddy fields fluctuates through the logistic curve from rice planting to its earring and approaches the maximum . From the earring to the mature period, the NDVI decreases and yields the minimum in rice reaping (Uchijima, 1976).
As NDVI fluctuates through a continuous curve, it can be interpolated with such a curve. Thus, NDVI for agricultural fields can be estimated through the year using such a curve as a logistic curve. Therefore, the next regression curves were applied for the time series of NDVI.
Air temperature curve :
where p and q are constants.
Logistic curve:
| NDVI = | A -------------- exp(-mt +n) +B |
+ D | (17) |
Logistic curve with periodicity:
| NDVI = | A -------------- exp(-mt +n) +B |
-Ct + D | (18) |
where t is time, and A,B,C,D, m and n are constants.
As a result, the time series of NDVI could be fitted with these curves very well except water surface as shown in Table 5. Using the air temperature curves as (16), the time series of NDVI was estimated. Eq. (17) gave good agreement with NDVI for less than 300 Julian day. Eq. 918) fitted with NDVI for all land covers almost through the year as shown in Figure 2. Among them, the best fitting of Eq. (18) was obtained for forest (r2=0.997) and grass (r2=0.971) with seasonal periodicity.
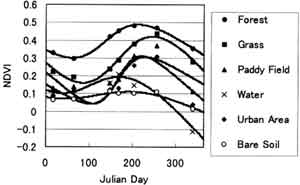
Figure 2. Time series of NDVI for each land cover and its regression curve
| NDVI | Forest | Grass | Paddy Field | Water | Urban Area | Bare Soils |
| Temperature | 0.951 | 0.616 | 0.659 | 0.275 | 0.645 | 0.603 |
| Logistic Curve | 0.648 | 0.650 | 0.309 | 0.002 | 0.196 | 0.092 |
| Logistic Curve(Julian Day <300) | 0.981 | 0.990 | 0.997 | 0.309 | 0.985 | 0.955 |
| Modified Logistic Curve | 0.997 | 0.971 | 0.726 | 0.956 | 0.523 | 0.904 |
| Land cover | Regression Lines | R2 |
| Forest | E = 13.89 NDVI - 2.415 | 0.744 |
| Paddy | E = 9.61 NDVI + 0.884 | 0.589 |
| Grass | E = 9.63 NDVI -0.124 | 0.509 |
| Bare Soil | E = 31.9 NDVI -0.406 | 0.755 |
| Urban Area | E = 9.44 NDVI + 0.749 | 0.634 |
3.3 Evapotranspiration and Regression for Vegetation
Table 6 shows the linear regression between daily evaportanspiration each land cover in Tade River watershed and the corresponding NDVI on the same day. Evaportanspiration for forest, as referred in the domestic reports, is estimated as 673 mm annually for conifers and 636 mm for broad leaf trees (Hattori, 1992). In the Saga Plains there are artificial forest as 66.5 % natural forest as 24.8 %, and no trees as 6.0 % of the total forest. Thus, the observed evaportanspiration is near these values. The estimates for evaportanspiration from NDVI should be though to include 20 to 40% of statistical errors. Therefore, NDVI may be used for the estimates for the estimates of evaportanspiration with the adjustment of the result of water budget method.
4. Conclusion
we concluded the nest items after the estimates of evaportanspiration from Tade River watershed using water budget and Penman methods, and the results of the time series of NDVI from the satellite data.
- In the estimates of evpotranspiration each land cover, Penman method lead to the overstimation more than water budget method. Penmn method should be applied for steady land covers such as forest, bare soils and water surface with the adjustment of water budget.
- In the estimates of evaportanspiration for agricultural fields, the methods combined with NDVI and water budget method may be valid for them.
- The linear regression between evaportranspiration and NDVI each land cover was obtained. Using this regression, daily evaportanspiration can be estimated. However, since the estimates may include 2-40% of statistical errors, the values should be adjusted by water budget method.
- The time series of NDVI for forest correlates with that of air temperature highly, therefore, NDVI for forest can be interpolated using the air temperature. The other NDVI except water surface correlates with daily air temperature (r2>0.6).
- Using logistic curves, NDVI for forest, paddy fields grass, urban area, and bare soils could be interpolated very well. Especially, high correlation was obtained for less than 300 Julian day. Moreover, using the logistic curves with seasonal periodicity, NDVI for almost all the land covers could be interpolated temporally. This method may be expected to interpolate NDVI temperally.
We would like to appreciate NASDA, Japan for providing SPOT data. A part of this study was collaborated with NASDA, Japan as a project study named "Agriculture Monitoring Using Satellite Remote Sensing". This study was carried out under a cooperative system for supporting priority research, which was implemented by Japan and Technology Corporation.
References
- Brutsaert, W. 1992, Evaporation into the Atmosphere, Kluwer Academic Pulishers, Boston, 299p.
- Campbell, G.S. 1985. Soil Physics with BASIC, Elservier Science Publishers, B.V.
- Hattori, s. 1992. "Evaporation and transpiration from forest",in Tsukamoto, Y (Editor), Forest Hydrology, Bun-eido Publishers, Tokyo, 319p.
- Nemani, R.R. and Running, S.W. 1989. "Estimation f Regionalsurface resistance to evaportanspiration from NDVI and thermal -IR AVHRRR data", Journal of Applied Meteorology, 28, 276-284.
- Rouse, J.W. Haas, R.H., Schell, J.A. and Deering J.A. 1973. "Monitoring vegetatin systems in the Great Plains with ERTS", Third Symposium on Significant Results Obtained with ERTS -1, NASA, SP-351, 309-317.
- Running, S.W. and Nemani, R.R. 1988. "relating seasonal patterns of the AVHRR vegetation index to simulated photosynthesis and transpiration of forests in different climates", Remote Sens. Environ, 24, 347-367.
- Sawamoto, M. and Shin, S. 1997. "Water balance evaluation in the Korean Peninsula through vegetation monitoring", Journal of the Remote Sensing Society of Japan, 17, 3, 220-231.
- Shin, S. and M. Sawamoto. 1996. "Evaluation of the annual water balance through vegetation monitoring", International Conference on Water Resources & Environment Research: Towards the 21th Century (Volume I), Water Resources Research Center, Kyouto University, Japan, 635-641.
- Uchijima, Z., 1976. "Radiation characteristics of maize and rice fields", In: Monteith, J.L. (Editor), Vegetation and the Atmosphere, Academic Press, N.Y.