| GISdevelopment.net ---> AARS ---> ACRS 1999 ---> Poster Session 5 |
Histogram Transformation
Based Threshold Selection for Image Segmentation
Pornphan Dulyakarn,
Yuttapong Rangsanseri, and Punya Thitimajshima
Department of Telecommunications Engineering, Faculty of Engineering, Faculty f Engineering
King Mongkut's Institute of Technology ladkrabang, Bangkok 10520
Tel : (66-2)326-9967, Fax : (66-2)326-9086
E-mail: doll_dulya@rocketmail.com, kryutta@kmitl.ac.th , ktpunya@kmitl.ac.th
Keywords: Image Segmentation, Karhunen-Loeve
Transform, Otsu Algorithm, Multithresholding, Co-occurrence Matrix.
Department of Telecommunications Engineering, Faculty of Engineering, Faculty f Engineering
King Mongkut's Institute of Technology ladkrabang, Bangkok 10520
Tel : (66-2)326-9967, Fax : (66-2)326-9086
E-mail: doll_dulya@rocketmail.com, kryutta@kmitl.ac.th , ktpunya@kmitl.ac.th
Abstract:
Multispectral remote-sensing image segmentation can be achieved by using a multithresholding technique, for which an automatic threshold selection method is presented in this paper. The monchrome version of the multispectral image is first derived by using Karhunen-Loeve Transform (KLT). The co-occurrence matrix method is then computed from this image, and used to construct a histogram. The threshold values are automatically determined from this histogram by using Otsu algorithm, and finally used for image segmentation by multithresholding. The better results were obtained by this method comparing with the direct application of Otsu algrithm.
1.Introduction
For image segmentation which is the process for subdividing an image into the homogeneous regions, thresholding is a well known technique and a widely used tool. Many threshold selection methods have been proposed (Sahoo, 1988). Each method can be suitably applied for some application depending on the purpose and the accuracy required. The basic and easiest way to determine the threshold of image in the case of binary image is based on finding two peaks of normal distribution from image histogram separated by a valley corresponding to the intermediate gray levels, which is used to divide the object and background into bilevel.
A segmentation algorithm of multispectral images has been proposed in our previous work(Dulyakarn, 1999). It is performed by applying a multithresholding technique, using otsu algorithm, on the first principal component image resulted from KLT of the input image. In this paper, an improvement to that work will be described. The idea is to use the gray-level co-occurrence matrix for histogram transformation prior to the application of Otsu algorithm.
2.The Proposed Method
Our segmentation algorithm of multispectral remote-sensing images can be depicted by the block diagram in Figure 1. first, Karhunen -Loeve or Hotelling Transform (KLT) is applied to the input multispectral image to produce the first principal component image. The co-occurrence matrix method is then computed from this image, and used to construct a histogram. The threshold values are automatically determined from this histogram by using Otsu algorithm, and finally used for image segmentation by multithresholding. The following subsections are dexcribed for more detail of these steps.
Figure 1: Block diagram of the proposed method.
2.1 Karhunen-Loeve Transform
The Karhunen-Loeve Transform (KLT) or Hotelling transform (Richards, 1994) is a rotation transformation that aligns the data with the eigenvectors, by the other hand this alignment is precisely the mechanism that decorrelates the data. The transformed image may make evident features not discernable in the original data or alternatively it might be possible to preserve the essential information content of the image for a given application with a reduced number of the transformed dimensions. The KLT can be considered by the eigenvalues and eigenvectors for developing a new co-ordinate system in the multispectral vector space, in which the data can be represented without correclation as defined by:
Y = Gx (1)
where y is a new co-ordinate system,
G is a linear transformation of the original co-ordinates that is the transposed matrix of eigenvector of the pixel data's covariance in x space
x is an original co-ordinate system
By (1), we can get the principal components and choose the first principal component from this transformation that seems to be the best monochrome representation of the input image.
2.2 Co-occurrence Matrix
Co-occurrence matrix (Jain, 1995) is extensively used in texture analysis. The method is based on the estimation of the second-order joint conditional probability density function, Pd,r(i,j), which is the 2-D matrix. Each Pd,r(i,j) is the probability of going from a gray level I to a gray level j in a given direction r at a given intersample spacing d. The co-occurrence matrix Pd,r is a representation of the estimated values. It is square matrix of dimension Ng, which is the number of gray levels in the image.
Two co-occurrence matrices are derived from the first principal component image, for r=0° and 90°, and d = 1, then summed together. A histogram can be constructed for the gray levels running from 0 to Ng-1. The cumulative frequency of occurring at each level x is defined by the Summation of all matrix elements with rounded -up value of (I+j)/2 equal to x, where I and j are row and column positions of the matrix (Ahuja, 1978).
2.3 Otsu Algorithm
(Otsu, 1979) proposed an algorithm for automatic threshold selection from a histogram of image. Let the pixels of a given image. Let the pixels of a given image be represented in L gray levels [1,2,….L]. The number of pixels at level i is denoted by ni, and the total number of pixels by N=n1 + n2 + …. + ni …. Then suppose that the pixels were dichotomized into two classes C0 and C1, which denote pixels with levels [1,… k] and [k+1,…, L], respectively. This method is based on a discriminant criterion, which is the ratio of between-class variance and total variance of gray levels :
The optimal thresholds of an image depend on maximizes s2B which seems equivalent with h, so as to maximize the separability of the resultant classes in gray levels.
3. Experimental Results
To compare our algorithm with Otsu algorithm, a synthetic image representing three classes of data was used. The original "ground truth" image is shown in Figure 2(a). An observed image, in Figure 2(b), was simulated by adding 15% Gaussian noise to the original one. The segmentation result obtained by the direct application of Otsu algorithm is given in Figure 2(c), compared to the result from the our algorithm in Figure 2(d). It is obvious that our algorithm is given in Figure 2(d). It is obvious that our algorithm is better. The segmentation error or these two methods are also provided in Table 1. The error is reduced from 11.96% to 7.81% when using the histogram transformation technique. In addition, Figure 3 is provided to compare two histograms, One calculated from the image gray values, and another calculated from the co-occurrence matrix. We can see that the classes are more clearly separate from each other in the histogram of Figure 3(a).
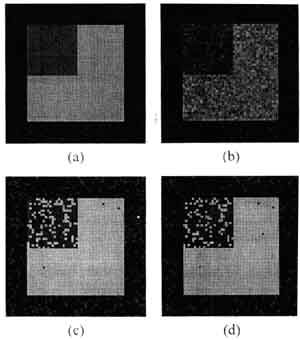
Figure 2: (a) Original image. (b) 15% noise added image. (c) Segmented image obtained by Otsu algorithm. (d) Segmented by the proposed algorithm.
(a)
(b)
Figure 3: Histograms calculated from the image gray values 9a), and the from the co-occurrence matrix (b).
| Number of pixels in the image | Error (%) | |
| Figure 2(c) | Figure 2(d) | |
| 4096 | 11.96 | 7.81 |
Another example illustrates the application of our algorithm to segmentation of remote -sensing multispectral images is given in Figure 4. A three near visible band image acquired by JERS -1 optical sensors was used, and shown in Figure 49a). Two threshold values obtained from our algorithm were 82 and 141, which result in segmenting the image into three classes and the result is shown in Figure 49b)
4. Conclusion
The gray-level co-occurrence matrix was used to produce a histogram that provides better results in the threshold selection process. A significant improvement by the algorithm presented was obtained and illustrated by using a synthetic image. Unsupervised classification of remote-sensing multispectral images is an application of such an algorithm.
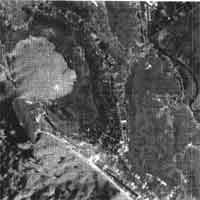
(a)
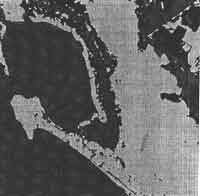
(b)
Figure 4: Experiment using a JERS-1/OPS image. (a) Original image (b) Segmented image.
5. Acknowledgement
The authors wish to thank the National Research Council of Thailand (NRCT) for providing the satellite image data.
References
- Ahuja, N. and Rosefeld, A., 1978. A note on the use of second-order gray-level statistics for threshold selection. IEEE Trans. Systems, Man, and Cybernatics, SMC-8 912), pp. 895-898.
- Dulyakarn, P., Rangsanseri, Y., and Thitimajshima, P., 1999. Segmentation of multispectral images based on multithresholding. In: 2nd International Symposium on Operationalization of Remote Sensing.
- Jain, R., Katsuri, R., and Schunck, B.G., 1995. Machine Vision. McGraw-Hill International Editions, pp. 234-239.
- Otsu, N., 1979. A threshold selection method from gray-level histograms. IEEE Trans. Systems, Man, and Cybernetics, 9(1), pp. 62-66.
- Richards, J.A., 1994. Remote Sensing Digital Image Analysis. Springer-Verlag Publishing Company, Inc., pp. 133-144.
- Sahoo, P.K., Soltani, S., Wong, A.K.C., Chen, Y.C., 1988. A survey of thresholding techniques. Computer Vision, Graphics, and Image processing, 41, pp. 233-260.