| GISdevelopment.net ---> AARS ---> ACRS 1999 ---> Poster Session 4 |
Desertification Monitoring
and Estimation in China from AVHRR Data
Long
Jing
Desertification Monitoring Centre
Academy of Forest Inventory & Planning,
18 Hepinglidongjie, Beijing 100714, P.R.China
E-Mail:lushilei@public3.bta.net.cn
Desertification Monitoring Centre
Academy of Forest Inventory & Planning,
18 Hepinglidongjie, Beijing 100714, P.R.China
E-Mail:lushilei@public3.bta.net.cn
Abstract
This paper discusses a method for desertification monitoring and estimation. Vegetation Index (VI) and Temperature Index (TI) can be get from AVHRR data. They are utilized for recognizing the features of desertification in China. Estimation indicators of desertification are abstracted from them.
Introduction
Desertification is one of the main global environmental problems. It has resulted in deteriorating environment and poor econemy , and imposed threat to the surviving environment of the overall mankind. Its damages have been found in one sixth of the global population and two third of the countries/regions in the world with an annual direct economic loss up to US$ 42.3 billion. This fact has called for international communities pay wide concerns and closed attention to desertification problem. To combat desertification and protect ecological environment of the earth have become the common action of mankind.
China is one of countries that are affected by desertification with serious adverse impact. One third of national terrestrial land is threatened by desertification. It is important especially for protecting natural resource and sustainable development in China to combat desertification.
According to the definition in UN convention to Combat Desertification, "Desertification" means land degradation in arid, semi-arid and dry sub-humid areas resulting from various factors, including climatic variation and human activities [1]. Land desertification is in macro scale and dynamic process. It is a significant task to monitor desertification status and dynamic changes timely and efficiently, to provide evidence for executives and planning sectors to assist them in making macro-decisions for combating desertification. This paper examines the approaches of desertification monitoring and estimation based on remotely sensed data in macro-scale.
Stydy Area and Object
The arid, semi-arid and dry sub-humid areas in China, classified by moisture index in 1981- 1990 (see following table) are the areas for this study, they are mainly distributed in 11 provinces/autonomous regions in northern and western China (Fig.1). Classification of desertification patterns are divided into following patterns according to the major external movement forces to cause desertification process
Figure 1 Climate types of desertification
According to the severity of desertification, each pattern above is divided into slight, medium and severe grading classes. The wind erosion desertification whose area is largest and damage is most
obvious in China, is objective for this study. Surface vegetation and temperature informations were abstracted from NOAA/AVHRR data (provided by EROS Data Centre of USA, helped by Mr. Zhu Zhiliang ). The parameters of remotely sensed data for desertification classes were drawn, and grading indicators of the severity of desertification were determined based on the ground survey data.
Indicators of climate types
classification[2]
Methods
AVHRR Data Processing
Three channels data of AVHRR (CH1, CH2 and CH4) were used in this study, they were acquired in March ~ August, 1995. Monthly cloudless daylight images of the whole study area were extracted and mosaicked.
Calculation of Vegetation Index
The normalized difference vegetation index (NDVI) of six month is calculated from Eq.(1) and mapped (Fig.2)
NDVI = (CH2-CH1)/(CH2+CH1) (1)
Calculation of Temperature Index
The temperature index (TI) is calculated using CH4 from Eq.(2) and mapped (Fig.3)
TI = (Ti-Tmin)/(Tmax-Tmin) (2)
Where Ti is CH4 brightness value of pixel to be calculated, Tmin is minimum valid value of CH4 and Tmax is maximum valid value of CH4.
Result Analysis
The Relation of NDVI to Desertification
Taking place and development of desertification directly influence the density and growth statues of vegetation. So, surface vegetation is a most important indicator to assess desertification. The NDVI that get from AVHRR reflect the statues of surface vegetation and have good relate with desertification. Average NDVI values of severe desertification in growth months are very low, less than 0.07. Of medium are less than 0.08 and slight are no more than 0.25.
The Relation of TI to Desertification
One of main characteristics in Desertification area is drought. Drought surface has high brightness value on CH4. It shows the high temperature. TI from Eq (2) clearly reflect the cases of desertification. Average TI value of severe desertification is very high up to 0.96. Of medium is 0.92 and slight is 0.77, no-desertified classes are 0.76~0.37, the values of cloud, snow and water body are less than 0.37.
Desertification Estimation in NDVI and TI Feature Space
Through image processing and analysis, the scattergram of NDVI and TI images was get. The graph of ground conditions in TI and NDVI space that mapped according to scatter distribution (Fig.4). Desertification evaluation indicators were defined based on relations showed on the graph. Point A represent high radiant temperature and dry bare sand. B present wet bare land. C to D represent full cover of vegetation. Line D-E reflect inverse relation between vegetation and surface temperature. Temperatures decrease with vegetation increasing. Except pure cloud, snow and bodies of water (NDVI and TI are close to zero or negative), other values are included in the area defined by line joining 5 top points. In this area, land desertification evaluation section was defined, then the indicators for desertification damage assessment were determined.
Conclusion
Results in this study shows that the information of land desertification can be gained and mapped efficiently from AVHRR data. NDVI and TI have a good relation with desertification damage, they are important parameters for desertification monitoring. Using them, we can determine the indicators for evaluating desertification damages, and establish the remote sensing information models for desertification monitoring and estimation. This is an effective approach for desertification monitoring in large area.
Figure 4 Scattergram and features space of TI and NDVI
Reference
This paper discusses a method for desertification monitoring and estimation. Vegetation Index (VI) and Temperature Index (TI) can be get from AVHRR data. They are utilized for recognizing the features of desertification in China. Estimation indicators of desertification are abstracted from them.
Introduction
Desertification is one of the main global environmental problems. It has resulted in deteriorating environment and poor econemy , and imposed threat to the surviving environment of the overall mankind. Its damages have been found in one sixth of the global population and two third of the countries/regions in the world with an annual direct economic loss up to US$ 42.3 billion. This fact has called for international communities pay wide concerns and closed attention to desertification problem. To combat desertification and protect ecological environment of the earth have become the common action of mankind.
China is one of countries that are affected by desertification with serious adverse impact. One third of national terrestrial land is threatened by desertification. It is important especially for protecting natural resource and sustainable development in China to combat desertification.
According to the definition in UN convention to Combat Desertification, "Desertification" means land degradation in arid, semi-arid and dry sub-humid areas resulting from various factors, including climatic variation and human activities [1]. Land desertification is in macro scale and dynamic process. It is a significant task to monitor desertification status and dynamic changes timely and efficiently, to provide evidence for executives and planning sectors to assist them in making macro-decisions for combating desertification. This paper examines the approaches of desertification monitoring and estimation based on remotely sensed data in macro-scale.
Stydy Area and Object
The arid, semi-arid and dry sub-humid areas in China, classified by moisture index in 1981- 1990 (see following table) are the areas for this study, they are mainly distributed in 11 provinces/autonomous regions in northern and western China (Fig.1). Classification of desertification patterns are divided into following patterns according to the major external movement forces to cause desertification process
- Desertification caused by wind erosion and eolian process;
- Desertification caused by water erosion and alluvial process
- Desertification caused by frozen and melting process at cold plateau;
- Desertification caused by soil salinization/alkilization and waterlogging;
- Desertification caused by other interacted factors (resultant factors).
Figure 1 Climate types of desertification
According to the severity of desertification, each pattern above is divided into slight, medium and severe grading classes. The wind erosion desertification whose area is largest and damage is most
obvious in China, is objective for this study. Surface vegetation and temperature informations were abstracted from NOAA/AVHRR data (provided by EROS Data Centre of USA, helped by Mr. Zhu Zhiliang ). The parameters of remotely sensed data for desertification classes were drawn, and grading indicators of the severity of desertification were determined based on the ground survey data.
| Climate Types | Moisture Index(MI) |
|---|---|
| Extreme arid area | MI < 0.05 |
| Arid area | 0.05 ³ MI < 0.20 |
| Semi-arid area | 0.20 ³ MI < 0.50 |
| Dry sub-humid area | 0.50 ³ MI < 0.65 |
| Humid area | MI £ 0.65 |
Methods
AVHRR Data Processing
Three channels data of AVHRR (CH1, CH2 and CH4) were used in this study, they were acquired in March ~ August, 1995. Monthly cloudless daylight images of the whole study area were extracted and mosaicked.
Calculation of Vegetation Index
The normalized difference vegetation index (NDVI) of six month is calculated from Eq.(1) and mapped (Fig.2)
Calculation of Temperature Index
The temperature index (TI) is calculated using CH4 from Eq.(2) and mapped (Fig.3)
Where Ti is CH4 brightness value of pixel to be calculated, Tmin is minimum valid value of CH4 and Tmax is maximum valid value of CH4.
Result Analysis
The Relation of NDVI to Desertification
Taking place and development of desertification directly influence the density and growth statues of vegetation. So, surface vegetation is a most important indicator to assess desertification. The NDVI that get from AVHRR reflect the statues of surface vegetation and have good relate with desertification. Average NDVI values of severe desertification in growth months are very low, less than 0.07. Of medium are less than 0.08 and slight are no more than 0.25.
The Relation of TI to Desertification
One of main characteristics in Desertification area is drought. Drought surface has high brightness value on CH4. It shows the high temperature. TI from Eq (2) clearly reflect the cases of desertification. Average TI value of severe desertification is very high up to 0.96. Of medium is 0.92 and slight is 0.77, no-desertified classes are 0.76~0.37, the values of cloud, snow and water body are less than 0.37.
Desertification Estimation in NDVI and TI Feature Space
Through image processing and analysis, the scattergram of NDVI and TI images was get. The graph of ground conditions in TI and NDVI space that mapped according to scatter distribution (Fig.4). Desertification evaluation indicators were defined based on relations showed on the graph. Point A represent high radiant temperature and dry bare sand. B present wet bare land. C to D represent full cover of vegetation. Line D-E reflect inverse relation between vegetation and surface temperature. Temperatures decrease with vegetation increasing. Except pure cloud, snow and bodies of water (NDVI and TI are close to zero or negative), other values are included in the area defined by line joining 5 top points. In this area, land desertification evaluation section was defined, then the indicators for desertification damage assessment were determined.
Conclusion
Results in this study shows that the information of land desertification can be gained and mapped efficiently from AVHRR data. NDVI and TI have a good relation with desertification damage, they are important parameters for desertification monitoring. Using them, we can determine the indicators for evaluating desertification damages, and establish the remote sensing information models for desertification monitoring and estimation. This is an effective approach for desertification monitoring in large area.
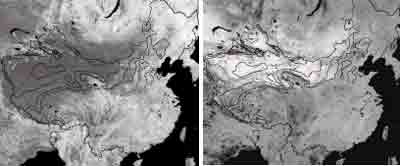 | |
| Figure 2 Image of VI | Figure 3 Image of TI |
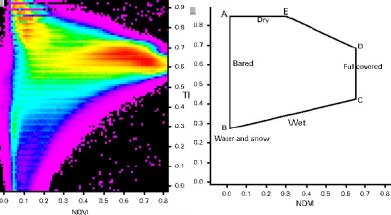 | |
| A Scattergram | B Features space |
Figure 4 Scattergram and features space of TI and NDVI
Reference
- “United Nations Convention to Combat Desertification in Those Countries Experiencing Serious Drought and/or Desertification, particularly in Africa”, 1994
- China National Committee for Implementation of the United Nations Convention to Combat Desertification, “China Country Paper to Combat Desertification”, 1997