| GISdevelopment.net ---> AARS ---> ACRS 1999 ---> Poster Session 4 |
Landsat -5 Tm Data Analysis
and Slope Mapping by GIS and Computer Technique, Showing Topographic
Gradient of Li and Thung Hua Chang Districts, Lamphun Province, Thailand
Manasan
Kantontong
Geographician (cartographer)
Forest Resource Analysis Division, Forest Research Office
Royal Forest Department, Bangkok, Bangkok 10900, Thailand.
Abstract
Geographician (cartographer)
Forest Resource Analysis Division, Forest Research Office
Royal Forest Department, Bangkok, Bangkok 10900, Thailand.
This study is to identify and then employ forest types, natural distribution of flora, forest land-use patterns as factors to produce forest map, forest land-use and topologically slope map within Li and Thung Hua chang Districts of lamphun Province. The study area is approximately 1,406,362.50 rais (2,250.18 square kilometers). Landsat -5 TM imageries (FCC : FCC : Falsi Color composite imageries) have been visually interpreted to identify different land-use land-use patterns comparing with black-and -white aerial photographs which have also been interpreted to identify different patterns of forest types, and data from toplogical maps to be further incorporated in details for the study. Then, check and correct the interpreative outcomes with ground data. The study has indentified data into 9 different categories as paddy field, agricultural cropland, mixed species orchared and natural stand, forest plantation, degraded and cleared forestlands, dry dipterocarps forest, mixed deciduous forest, hill evergreen forest and water catchment area. Enter data into computer system and then analyzing spatial data to be utilized later on for the production of the study map. Utilize thecomputerized SPANS programme version 6.0 which has been operated on OS/2 system in Windows 95 to interpret and identify the data, then save and bring them up to organize spatial database and finally create topological slope map of the study area. From the overlay analysis of different layers of data, especially the forest types layer and the 1997 land-use pattern layer (which has been visually analyzed) which have been overlaid upon the topologically slope layer, the study has successfully fixed forested and non-forested areas onto the topological different sloping positions of the study area. The study outcomes usefully help create understandings of the nature of topological slopes in Li and Thung Hua change Districts in relationships with natural distribution of flora. Most forested areas lie upon high slopes and possess few agricultural potentiality. These high slopes cause severe landslides and illegal land denudation. So, they should be preserved as forested areas and should be reforested urgently within cleared and degraded patches where water catchment ability of the land is potentially high.
1.Introduction
Presently, large areas of Li and Thung Hua Chang forests in Lamphun province have been extensively cut, partly occupied and agriculturally developed by local people. In order to follow -up and limit the mentioned illegal occupation, Royal Forest Department (RFD) should possess updated database and a mapping system of Li and Thung hua Chang Districts. Such databases should be used to plan the budget - saving law enforcement and land surveying efforts. Economically GIS, computerized techniques, and topologically slope maps are effectively employed to monitor the changing data of Li and Thung Hua change forest resources. By these high techniques, the forest resources conservation can be sustainably maintained.
2. Objectives
2.1 to assess the existing forest land in the study areas (Li and Thung Hua Chang Districts) by employing Landsat - 5 TM imageries, data interpreted from aerial photographs and ground check.
2.2 to produce forest map and forest land -use of Li and Thung Hua Chang Districts overlaying by slope map.
2.3 To test the functional feasibilities and efficiency of the PC software SPANS package version 6.0 in terms of its processing and overlay techniques.
2.4 To generate the topological slope map for RFD use.
3. Study areas
Li and Thung Hua Change Districts of Lamphun Province are in northern Thailand between latitudes 17o 25 00''N - 18o 15 00'' N and longitude 98o 40 00'' E - 99o 15 00'' E with 2,250.18 Sq.kms. total area combined. Meteorological data collected within 30 years span has been indicted that their annual average temperature is 26.1oC, relative humidity is 71.4% and the average amount of precipitation is 980.7 mm. yearly. These data are closely related with the appearance of natural forest covers.
4. Material and data sources
The study employs
4.1. Topographic map of 1:50,000 and 1 : 250,000 scales.
4.2. Landsat -5 TM imageries of 1:250,000 scale (FCC) dated 21 February 1995 and 11 January 1995.
4.3 spatial data of Li and Thung Hua Chang Districts obtained from the digitizer with contour lines, spot height, political boundary, roads, rivers and villages.
4.4 Forest types map which interpreted from aerial photographs .
4.5 Field data obtained from ground check.
5. Procedures
5.1 Hardware and software
Hardware :
- micro - computer with operating system OS/w warp version 3.0 window 95
- memory 128 MB
- Hard Disk 2 GB
- CD - Rom Drive
- Floppy Disk Drive Internal 1.44 MB
- Colour monitor 15"
- HP design Jet 750 C plus printer
- Calcom Drawing Broad III, 16 Bottom, Cursor - Corded.
- Powerback UPS. etc
The package software "SPANS" (Spatial Analysis System) version 6.0 produced by the PCI Economics Group, Canada.
5.2 Methodology
5.2.1 Field Data Collection
Before analysis, classification and overlaying techniques, field data of the study area have been collected by random sampling method, ground checking data of existing forest and land - use pattern have been use to be at a spot checking step during classification.
5.2.2 Analysis and classification
Mainly aerial photographs were used to extract variables of forest land-use patterns and the spot checking information collated with the Landsat-5 TM imageries to produce forest map via visual interpretation. The forest type map and the 1997 land - use pattern map were obtained (see Annex A:) and linked with GIS data by entering spatial data of contour lines, spot height, political boundary, roads, rivers, villages and visual interpreted forest cover) into a computer system then processed and analyzed them by a special software naming "SPANS" version 6.0 with the OS/2 warp version 3.0 and Microsoft window 95. Final outcome was obtained to produce topological slope map overlaid later upon the layers of forest type and 1997 land - use pattern to help identify the accuracy. (see Annex B)
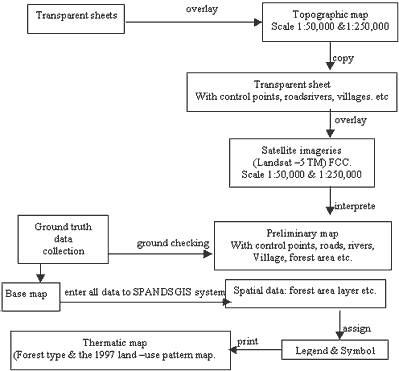
Annex A : Study Process
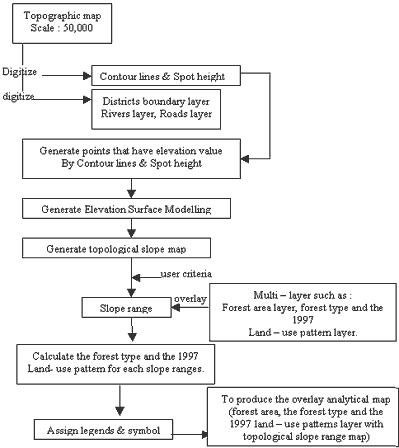
Annexure B : Procedure for Toplogical Slope Map and overlay process to produce a Composite overlaid maps of Slope ranges and Land - use patterns.
| Categories | Slope ranges (sq.kms.) | |||||||
| 0-2% | 2-5% | 5-12% | 12-20% | 20-35% | 35-50% | 50% | Total area | |
| Paddy field Agricultural cropland Mixed species orchard and natural stand Forest plantation Degraded and Cleared forestlands Dry Dipterocarps forest Mixed Deciduous forest Hill evergreen forest Water body |
55.19 137.06 16.97 5.42 133.48 163.68 40.73 0.07 7.87 |
19.82 61.97 5.50 2.77 78.39 113.54 39.18 0.27 1.12 |
11.90 45.16 0.33 8.31 73.83 177.72 85.75 0.94 1.30 |
3.40 12.97 0.03 10.12 41.59 115.85 82.36 1.51 0.95 |
1.43 8.86 0.02 4.93 33.54 134.74 118.72 2.98 1.12 |
0.51 3.44 0.01 1.98 16.28 77.46 79.07 2.95 0.68 |
0.67 2.96 0.01 1.28 19.55 80.90 93.59 3.64 1.73 |
92.92 272.42 22.87 34.81 396.66 863.97 539.40 12.36 14.77 |
| Total area | 560.47 | 322.56 | 405.24 | 268.78 | 306.34 | 182.38 | 204.41 | 2,250.18 |
The study shows the distribution of forested and non forested areas. The study outcome ends up with co-relations between topological sloe range and existence of nature forest types in Li and Thung Hua chang districts and the vicinity.
6.Study Results
At the end of this study, slope maps, forest cover maps, and composite overlaid maps of slope ranges and land - use patterns have been produced. This study procedure can be employed in other areas throughout the country.