| GISdevelopment.net ---> AARS ---> ACRS 1999 ---> Poster Session 4 |
Composite Image of NDVI and
SST for Asian Region using AVHRR Imagery
Ryuzo Yokoyama*, Liping
Lei*, Ts. Purevdorj* and Sumio Tanba**
*Department of Computer Science, Iwate University, Japan
**Hirosaki University, Japan
3-4-5 Ueda, Morioka, Iwate, Japan, 020-8551
Tel: (81)-19-621-6478, FAX : (81)-19-629-2801
E-mail :yokoyama@cis.iwate-u.ac.up
Abstract*Department of Computer Science, Iwate University, Japan
**Hirosaki University, Japan
3-4-5 Ueda, Morioka, Iwate, Japan, 020-8551
Tel: (81)-19-621-6478, FAX : (81)-19-629-2801
E-mail :yokoyama@cis.iwate-u.ac.up
The composite image are produced from HPRT data received at Tokyo University, Kuroshima (Japan), Ulaanbaatar (Mongolia) and Bangkok (Thailand). The compositing method is based on the selection maximum NDVI and minimum scan angle for land surface, and minimum value of channel 2 and maximum value of channel 4 for sea surface. The processing chain includes radiometric calibration, geometric registration, compositing and atmospheric correction. The final product is an image data set of 10 layers which include NDVI and SST, reflectances of channel 1 and 2, brightness temperature of channels 3, 4 and 5, sun-target-sensor geometry of sensor zenith, solar zenith and relative azimuth angles and measurement date of the each pixel selected. A prototype composite image was produced for the period of 1-10 August 1998 production of 10-day composite for 1998 is undertaking.
1.Introduction
The availability of daily Advanced Very High Resolution Radiometer (AVHRR) imagery which covers very large regions has been shown to be useful for monitoring global environmental conditions. However, the use of daily AVHRR data has difficulties because of obtaining sufficient cloud free images. AVHRR image, however, ahs major advantages such as high frequent overpass and wide scanning provides the chance of producing cloud free images by compositing AVHRR images collected in regular intervals. Taking these advantages of AVHRR, the compositing procedure which is a widely accepted technique for AVHRR data make it possible to produce cloud free composite data. The composite AVHRR data is particularly important for continues monitoring at regional and continental scales. However, for users of the data, it has been often showed difficult to collect, preprocess and produce multi-temporal AVHRR data set. A number of processed AVHRR data sets are conducted on imagery from North America, Sahelian Africa, South American and African tropical forest, European continent and also global land 1-km AVHRR data set (EROS DATA Center) is available for 1992-1995. In spite of the existing AVHRR data set for global and continental scale, there has been relatively little practical contribution to multi-temporal AVHRR database for Asian region is important attribute to fundamental understanding the ecology in Asian region.
In this paper we describes automatic processing system for generating 10-day composite image of AVHRR data for Asian region developed in the Laboratory of Remote Sensing Data Analysis, Iwate University.
2.The Composite Data Set
The AVHRR composite data set includes the region with the top left coordinate of 80oN, 50oW, and the bottom right of 20oS. 180oE, Data volume of the composite image of 14400 pixels and 1200 lines is 3.4GB. The composite image has 10 channels that include:
- AVHRR channel 1 Reflectance (%)
- AVHRR channel 2 Reflectance (%)
- AVHRR channel 3 Brightness temperature (Centigrade)
- AVHRR channel 4 Brightness temperature (Centigrade)
- AVHRR channel 5 Brightness temperature (Centigrade)
- Sensor zenith angle (degrees)
- Solar zenith angle (degrees)
- Relative azimuth angle (degrees)
- NDVI-SST (sea surface temperature), NDVI for land SST for sea surface (Centigrade)
- Julian day
3. Data Processing Flow
The AVHRR raw data of NOAA-14 afternoon passage collected daily at Tokyo Universty, Kuroshima (Japan). Asian Institute of Technology (AIT) (Thailand) and Ulaanbaatar (Mongolia) receiving stations were used in the composite image. On considering computing resource and data processing method, the AVHRR raw data for the each receiving station was processed separately according to the fixed mapping area (Table 1) and subsequently the image were mosaicked into final composite image.
| Receiving Station | Left top corner | Right bottom corner |
| Tokyo University | 130°E, 70°N | 170°E, 15°S |
| Kuroshima | 110°E, 45°N | 170°E, 0°S |
| AIT | 60°E,35°N | 140°E, -20°S |
| Ulaanbaatar | 50°E, 80°N | 170°E, 30°S |
The laboratory of Remote Sensing Data Analysis of Iwate University receives raw data of AVHRR on 8-mm cartridges from the ground receiving stations. The ground receiving stations have different data format from the input format for "PaNDA" software that is to be used to preprocessing. Therefore, before the processing routine, the AVHRR raw data was converted to the format compatible with input format for "PaNDA" software.
At present the data processing flow include following steps and first prototype composite image was tested:
- Systematic correction
- Geometric registration
- Composting
- Atmospheric correction
The systematic correction performed by "PaNDA' software includes calibration of five channels, ground control point (GCP) matching with coastline and resampling.
At first, the percent albedo measured by the sensor channel 1 and 2 is computed as linear function of digital number (DN) as follows:
Where Ai is the percent albedo of channel I, Si and Ii are the scaled slope and intercept values for channel I respectively. The pre-launch slope and intercept values for AVHRR channel 1 and 2 were used from source calibration information of NOAA/NESDIS. The calibration coefficients for channel 3,4 and 5 are derived onboard blackbody and deep space reference. The calibration process converts raw DN to linear radiance using following equation:
where RLIN is the linear radiance, Mi and Li are gain and intercept coefficients of channel I respectively. The quantity Mi, Li (in units of radiance/count) is calculated for each channel from onboard blackbody and deep space reference. The linear radiance calculated was corrected the non-linearity as follows:
where R is corrected radiance, Ai,Bi and Ci are correction coefficients for channel I. Then the radiance value was converted to brightness temperature using sensor spectral sensitivity weighted method.
Second step of the systematic correction is the GCP matching and correction for terrain elevation. The digital elevation data used for the correction is GTOPO30 (Global 30 Arc Second Elevation Data, USGS). The control points and coastline image were warped into the satellite projection for the correlation process. The ground control matching uses automatic correlation of image segments of the AVHRR data with ground control points identified from hydrological feature of Digital Chart of the World (DCW0 and then integrates the adjustments derived from the correlation with the orbital model.
Third, the image was resampled using the nearest neighbor interpolation method and radiometric and geometrically corrected (systematic) image was produced. The resulting image includes all five channels and sun target geometry angles data.
b. Gemetric registration
A systematic correction using satellite model alone can not achieve required multi-temporal accuracy in the composite image. The correction result of the "PaNDA' software showed that there is still an insufficient accuracy in the output images and it causes "blurring" in the composite images. Therefore, in order to prevent "blurring" in the compositing process, an image registration procedure was done. An image from coastline image with image segment derived from the AVHRR data. Here we used line matching for coastline and pattern matching for rivers. The image segment for the line matching is created in the following way. At first, image of 64 by 64 data is extracted from the AVHRR channel 1 and 3 centered at the ground control points (GCP) position and then a binary image is created from the image by thresholding Normalized Difference Vegetation Index (NDVI) value. The pixels of the binary image have a value 1 for land area and 0 for water area. Then the edge image generated from the binary image by edge extraction was correlated with template image. The image segment for pattern matching is produced as previous but edge line was not extracted.
The coast and shoreline data was collected from DCW and hydrological feature of rivers was generated from water mask data (EROS DATA Center). Then coastal data was transformed to coastline image with same size of the output image. The template image of 32 by 32 data for the matching is generated from the coastline image centered GCP position. Also GCP data set was developed from DCW. The matching result of the template and edge image was selected according to threshold matching value. Then the resampling is performed using the nearest neighbour algorithm.
c. Compositing
At first, the length of the compositing period of 10 days was used, which has the advantage of a common reporting period for agronomic and biophysical characteristics. The different compositing techniques for land and sea area are respectively proposed.
The compositing image for land area are commonly produced using the maximum value compositing (MVC) tedhnique based on NDVI (Holben, 1986). When the MVC approach was originally proposed, it was argued that the method would preferentially select near-nadir views over larger scan angles. The work that led to that recommendation was based on a model using an assumption of Lambertian reflectance from the earth surface. Numerous studies have found that off-nadir viewing can produce greater NDVI values than at nadir viewing angles (Cihlar et. al., 1994). We have observed too, that the MVC algorithm preferentially selected forescattering views over nadir for a variety of cover types in north-east region of Asia, specially when using atmospherically corrective AVHRR data (Kawada et. al., 1998). Therefore we propose to use the multiple criteria composting technique by using maximum NDVI and minimum scan angles (MaNMis). The composite technique was performed in the following steps as follows:
Step 1: NDVImas (1,p) = MAX{NDVI(1,pd)} d = 1,2,……. 10
Step 2: If NDVI(1,p,d)/NDVImax(1,p) >0.85; (1,p,di) pixels retained
Step 3: Pixel (1,p) is selected when smin(1,p)= MIN{S(1p,di)}
Where NDVI (1,p,d) si the NDVI calculated from apparent reflectance of Channels 1 and 2 for pixel (1,p) on data d; NDVImax(1,p) is the maximum NDVI value of the pixels (1,p) for the compositing period; di refers to the value NDVI(1,p,d) found within 15% of NDVImax(1,p), smin (1,p) is the minimum scan angle among the all retained pixels di from step 2. The result from this multiple criteria compositing techniques is compared with the other two compositing techniques of maximum brightness temperature of Channel 4 and MVC. In comparision with those two methods, MaNMiS technique is directed to preferentially to select the nearest nadir pixel over larger scan angle. Moreover, a compositing technique for sea surface area is developed using AVHRR Channel 2 and Channel 4. At first, the sunlit pixels were removed using threshold value (10%) of apparent reflectance of Channel 2. Then the pixel with maximum brightness temperature of Channel 4, which is less than the threshold value of Channel 2, was selected for the composite.
d. Atmospheric Correction
The impact of atmospheric effects on AVHRR composite imagery of Channels 1 and 2 still is significant, although the compositing has been used to remove cloud contamination and atmospheric effects. An atmospheric correction algorithm for AVHRR imagery in the operational mode is used (Lei and Yokoyama, 1997). The algorithm works with look-up tables (LUTs) of the atmospheric corrective parameters derived from 6S and maintained in a production environment. However this algorithm is validly when solar zenith angle and sensor zenith angle is less than 60 and 50 degree respectively in the input geometrical parameters. For atmospheric profile models, a standard climatology with latitudinal, seasonal dependence are used, and the aerosol model was taken to be continental. The elevation data corresponding to imagery area was taken from GTOPO30. The output of atmospheric correction for every pixel is the surface reflectance of Channels 1 and 2. For atmospheric conditions, subarctic summer, Midlatitude summer and Tropical atmospheric profile are used for the pixels located between 80oN and 50oN, 50oN and 23oN, and between 23oN and 20oS respectively. The aerosol concentration is taken in visibility 60km (assumed very clear atmosphere).
4.Prototype Composite Image
The automatic processing system processed NOAA -14 afternoon AVHRR raw data for August 1-10, 1998 and produced prototype 10-day composite image for Asian region (Figure 1). 82 scenes of raw AVHRR data were used for the prototype composite image.
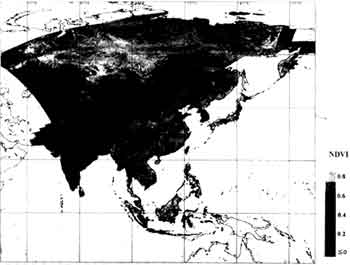
Figure 1: NDVI composite image of Asian region for August 1-10, 1998
Conclusions
The first prototype of Asian 1-km composite imagery have been created from the raw 1-km AVHRR data received from ground receiving stations of Tokyo University, Kuroshima (Japan), AIT (Thailand) and Ulaanbaatar (Mongolia). The composite images will contribute to research activity in environmental analysis of Asian region. During the development of AVHRR composite data set, it has been showed difficulties in the data processing because of frequent cloud coverage over large areas and geometric distortion at large scan angle associated with the edges of the across-track scan. Despite the number of difficulties, the improvement of the data processing method should lead to increase a quality of the composite images.
Acknowledgement
The research is partially supported by Research and Development applying Advanced Computational Science and Technology, Japan Science and Technology Corporation and Telecommunications Advanced organization of Japan.
References
- J. Cihlar, D.Mnak, and M.D'Iorio, 1994. Evaluation of Compositing Algorithms for AVHRR Data Over Land, IEEE TRANSACTIONS ON GEOSCIENCE AND REMOTE SENSING, 32 (2), pp. 427-437.
- Liping Lei, Mituo Koide, 1998. Yoshikazu Iikura, and Ryuzo Yokoyamma, Correction of Atmospheric effects on AVHRR Imagery by 6S code, Journal of Remote Sensing Societyof Japan, 18(2), pp. 51-64.
- BRANT N. HOLBEN, 1986. Characteristics of maximum-value composite images from temporal AVHRR data, INT.J. REMORTE SENSING, 7 (11), pp. 1417-1434.
- Rie Kawada, Liping Lei, and Ryuzo Yokoyama, 1999. Bidirectional reflectance effects on AVHRR images, Proceedings of the Joint Conference of JSPRS and RSSJ, Chiba University pp. 311 -314.