| GISdevelopment.net ---> AARS ---> ACRS 1999 ---> Poster Session 4 |
Classification of
Multi-Temporal Sar Images and Insar Coherence Images using Adaptive
Neighborhood Model and Simulted Annealing Approch
Mingquan BAO
Center for Remote Imaging, Sensing and Processing
The National University of Singapore
Blk S17, Lower Kent Ridge Road, 119260, Singapore
Tel: (65)8744322, Fax: (65)7757717
E-Mail:crsbaomq@leonis.nus.edu.sg
Center for Remote Imaging, Sensing and Processing
The National University of Singapore
Blk S17, Lower Kent Ridge Road, 119260, Singapore
Tel: (65)8744322, Fax: (65)7757717
E-Mail:crsbaomq@leonis.nus.edu.sg
Keywords: Multi-temporal SAR images, InSAR
coherence image, Classification, Fuzzy c-mean clustering, Possibility
c-mean clustering, Simulated annealing, Adaptive neighborhood model
Abstract:
A classification algorithm for multi-temporal SAR images and InSAR coherence images is developed. This is done by minimizing an energy function which is defined by the sum of (1) the difference between the pixel value and the cluster center (mean value of a class) and (2) the difference between the pixel label (class) and its neighborhood. The global minimization of the energy function of the whole image is achieved by a simulated annealing approach. The cluster centers for different classes are calculated using fuzzy c-mean and possibility c-mean algorithms or determined manually from the image values. In order to preserve the details of the original images, a neighborhood structure with a 5*1 window is used to calculate the energy function, whose orientation is determined by the local homogeneity (e.g. the variance of the pixel values within the window) of the original images. This algorithm is used to classify three ERS-2 SAR images over the Mekong delta region, Vietnam. By comparing visually the color composite SAR images and the classified image, it is shown that the classification result is reasonable. Moreover, this algorithm is also used to classify an InSAR coherence image acquired from two JERS SAR images over south Sumatra, Indonesia. The classified InSAR coherence image delineates the bare land and forest clearly, since the coherence of bare land is larger than that of forest.
1. Introduction
Multi-temporal ERS-1/2 synthetic aperture radar (SAR) images show not only the radar backscattering properties of objects within one image but also the time evolution of radar backscattering. Interferometric SAR (InSAR) images generated from two repeat-pass single-complex SAR images give coherence properties of radar backscattering between the two SAR images. The information contained in multi-temporal SAR images and InSAR coherence images has been used successfully to monitor forest cover and rice fields (Liew, et. al, 1998). Classification of objects is an important step in many applications. This is carried out by (1) determining the cluster statistical characteristics of different classes, e. g., the mean value of classes; (2) classifying every pixel according to the clustering result and other conditions, for example, smooth homogeneous regions and at the same time preservation of the fine structural details. It often happens for SAR images that mixed-up classes occur within a homogeneous region due to noise. The preservation of fine structures is often required when utilizing SAR data for cartography, urban planning, and analysis of agricultural sites, especially, detecting roads.
In this paper we apply fuzzy c-mean (FCM) and possibility c-mean (PCM) clustering algorithms to cluster images (Cherkassky and Mulier, 1998; Wong and Posner, 1993). The results of these two algorithms are compared. Then, we use a classification algorithm which is based on the adaptive neighborhood model (Garzelli, 1999) and the simulated annealing technique (Hegarat-Mascle and Vidal-Madjar, 1996), to obtain smooth homogeneous regions but preserve fine structures.
2.Clustering Algorithms
The goal of clustering is to partition an image set into a small number of groups or representative clusters. The fuzzy c-mean clustering algorithm seeks to find fuzzy partitioning by minimizing the following loss function:
where xi denotes the data vector (i=1, . . . ,n), n the total number of pixels, cj the center of a fuzzy cluster (j=1, . . . ,m), m the number of fuzzy clusters assumed to be known, µj(xi) the fuzzy membership of xi to cluster j. The parameter b>1 is a fixed value specified a priori. Typically b is chosen around 2. The necessary conditions for an optimal solution are
Performing differentiation and applying the constraint
leads to
Here dji denotes the Euclidean distance between the data vector and the cluster center.
The system of nonlinear equations can be solved by an iterative process, which is known as the FCM algorithm
1) Set number of clusters m and parameter b
2) Initialize cluster centers cj
3) Repeat:
Update membership values µ j(xi) via (4) using current estimates of cj and update cluster centers cj via (5) using current estimates of µ j(xi) until the membership values stabilize;
In FCM algorithm the noise and outliers in the data set create many spurious local minima and distort the solution that corresponds to the global minimum. Thus, a possibility c-mean (PCM) clustering algorithm was proposed by adding a term to the loss function
where nj denotes suitable positive numbers. Similar to the FCM algorithm the optimal solution can be achieved by iteration, using
This is done by alternating between the estimation of the cluster membership values (for the given values of cluster centers) and the estimation of the cluster centers (for the given membership values).
3. Classification Algorithm
Once the cluster centers have been estimated, the whole image set is classified by assigning labels to every pixel. The label, l=1, . . . m, is an integer value and represents classes. If the classification is carried out according to only the condition that the Euclidean distance between the data vector and the cluster center reaches a minimum, some regions appear somewhat mottled, with isolated pixels of one class embedded within larger regions of another class, i.e., mixed-up classes. Generally, one expects neighboring pixels to belong to the same class unless there is a true border between regions. Thus, we assume the field of labels is a Markov Random Field (MRF): the probability of a pixel to be labeled k knowing the labels of all other pixels in the image is equal to the probability of a pixel to be labeled k knowing the labels of its neighbors. The classification is realized by minimizing an energy function. It consists of its own energy U1 and energy U2 related to its neighborhood N. For each pixel, i, U1 and U2 are defined as
where ß is a weighting factor ( ß³0) and d is the Kroeneker symbol:
and N represents the neighborhood structure. Usually, the number of pixels within a neighborhood structure is predefined. The shape, in contrast, is not fixed, but is adapted to data. Here, the neighborhood structure is a 5*1 window with different orientations (shown in Fig. 1). One of the neighborhood structures is selected on which the variance of the data has the minimum value. Thus, by using the adaptive windows we take into account the local homogeneity and improve the detail preservation.
A classification is optimal if the global energy E over the whole image
is minimum. Global minimization is achieved by a simulated annealing approach.
Fig. 1 Neighborhood structures for classification algorithm
4. Simulated Annealing Algorithm
The concept of simulated annealing (SA) is based on an analogy between the thermodynamic behavior of solids and large combinatorial optimization. The basic procedure involves a cooling procedure, in which a þ temperature þ parameter starts out high and is gradually lowered until the system is þ frozen þ (in a state of minimal energy). In the simulated annealing algorithm, not only are state changes accepted which decrease energy, but also some state changes are accepted which increase energy with a defined probability. However, the lower the temperature, the less likely is any significant energy increase.
Simulated Annealing algorithm is implemented as follows
1) Choose initial temperature T0, assign the class label to every pixels randomly
2) Repeat
For each pixel, change randomly its label from class i to class j,
Compute DUij=Ei-Ej and accept the change,
when DUij 0, or, with a probability exp (-DUij/T), when DUij>0,
Tnew=u*Told (0 <u <1),
Until Tnew <Tend where Tend is the freezing temperature.
5. Results and Discussion
Multi-temporal ERS-2 SAR images over the Mekong river delta region, Vietnam, acquired on May 5, June 9, and July 14, 1996, respectively, are considered to test the algorithm. Their color composite image (RGB) is shown in Fig.2(a) (Liew, et. al., 1998). Each image has been processed as follows (Liew, et. al., 1998): (1) lowpass filter with a 5*5 averaging window; (2) downsampling to 50m pixel size; (3) adaptive Wiener filter; (4) 3*3 median filter. The cluster centers are calculated by applying FCM and PCM algorithms to the preprocessed data.
Table 1. Cluster centers calculated by FCM algorithm
Table 2. Cluster centers calculated by PCM algorithm
Table 1 and 2 show that the cluster centers calculated from the two algorithms are very similar. Comparing the individual values, the relative difference (|cFji-cP ji|/ cFji) is smaller than 7%. One exception is cluster 3 (c3), but it represents the same class in these two results, i. e., those pixels that have small values and change rarely. The close agreement of the cluster centers is probably due to the fact that the noise in the SAR images has been reduced effectively. Using the cluster centers calculated by FCM and the classification algorithm described above, we obtain the classification result shown in Fig. 2(b). False color represents different classes. Even though only 6 classes are used, the main characters of multi-temporal SAR images are highlighted. There are no mixed-up classes within the homogeneous regions, e. g., the regions represented by red and green. Meanwhile, a lot of fine structures, e. g., roads are preserved.
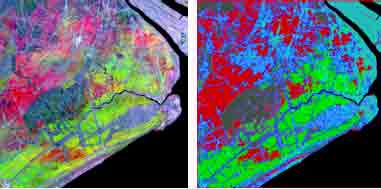
Fig. 2 (a) Color composite image of multi-temporal SAR images. (Red: May 5, Green: June 9, Blue: July 14, 1996)(Liew, et. al., 1998); (b) False color composite classified image.
In addition, we now apply this classification algorithm to a InSAR coherence image that is processed from two JERS single look complex SAR images. They were acquired on June 1 and October 11, 1996, covering a region of south Sumatra, Indonesia. Fig. 3(a) shows the InSAR coherence image. The bright region (high coherence) is bare land and the dark region (low coherence) is forest. If we classify the whole image into two classes, i. e., forest and bare land, the cluster centers can be determined interactively. The classification result is shown in Fig. 3(b). Despite the high noise in the coherence image, the bare land and forest can be delineated clearly. However, if the coherence image is classified only according to the cluster center without considering (neighborhood) texture information, the image can not be classified properly (shown in Fig. 3(c)), and the mixed-up of classes is very serious.
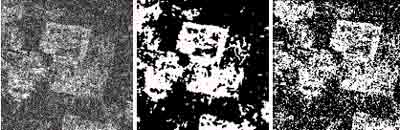
Fig. 3(a) In SAR coherence image. The bright pixels (high coherence) correspond to bare land and the dark pixels (low coherence) to forest; (b) InSAR coherence image classified into bare land (bright region) and forest (dark region); (c) InSAR coherence image classified without using (neighborhood) texture information.
6. Conclusion
A set of multi-temporal SAR images is considered to test the classification algorithm. Firstly, the cluster centers are calculated automatically by using fuzzy c-mean and possibility c-mean algorithms separately. The obtained cluster centers nearly agree with each other. Secondly, each pixel is classified into different classes by minimizing an energy function. This energy function contains cluster centers and the neighborhood information. The neighborhood is chosen based on the local homogeneity. Thus, the fine structures in the image are preserved, meanwhile, mixed-up classes in the homogenous regions are reduced effectively. Finally, this classification algorithm is applied to an InSAR coherence image. The whole image is classified into forest and bare land. A satisfactory result is obtained, even though the coherence image is very noisy.
7. Acknowledgments
The author would like to thank Dr. Liew and Ms. Chen, for providing SAR images after registration and speckle noise removal; and Prof. Nokayama at Tokyo University of Agriculture and Technology, for providing a sample of JERS raw data.
References
Abstract:
A classification algorithm for multi-temporal SAR images and InSAR coherence images is developed. This is done by minimizing an energy function which is defined by the sum of (1) the difference between the pixel value and the cluster center (mean value of a class) and (2) the difference between the pixel label (class) and its neighborhood. The global minimization of the energy function of the whole image is achieved by a simulated annealing approach. The cluster centers for different classes are calculated using fuzzy c-mean and possibility c-mean algorithms or determined manually from the image values. In order to preserve the details of the original images, a neighborhood structure with a 5*1 window is used to calculate the energy function, whose orientation is determined by the local homogeneity (e.g. the variance of the pixel values within the window) of the original images. This algorithm is used to classify three ERS-2 SAR images over the Mekong delta region, Vietnam. By comparing visually the color composite SAR images and the classified image, it is shown that the classification result is reasonable. Moreover, this algorithm is also used to classify an InSAR coherence image acquired from two JERS SAR images over south Sumatra, Indonesia. The classified InSAR coherence image delineates the bare land and forest clearly, since the coherence of bare land is larger than that of forest.
1. Introduction
Multi-temporal ERS-1/2 synthetic aperture radar (SAR) images show not only the radar backscattering properties of objects within one image but also the time evolution of radar backscattering. Interferometric SAR (InSAR) images generated from two repeat-pass single-complex SAR images give coherence properties of radar backscattering between the two SAR images. The information contained in multi-temporal SAR images and InSAR coherence images has been used successfully to monitor forest cover and rice fields (Liew, et. al, 1998). Classification of objects is an important step in many applications. This is carried out by (1) determining the cluster statistical characteristics of different classes, e. g., the mean value of classes; (2) classifying every pixel according to the clustering result and other conditions, for example, smooth homogeneous regions and at the same time preservation of the fine structural details. It often happens for SAR images that mixed-up classes occur within a homogeneous region due to noise. The preservation of fine structures is often required when utilizing SAR data for cartography, urban planning, and analysis of agricultural sites, especially, detecting roads.
In this paper we apply fuzzy c-mean (FCM) and possibility c-mean (PCM) clustering algorithms to cluster images (Cherkassky and Mulier, 1998; Wong and Posner, 1993). The results of these two algorithms are compared. Then, we use a classification algorithm which is based on the adaptive neighborhood model (Garzelli, 1999) and the simulated annealing technique (Hegarat-Mascle and Vidal-Madjar, 1996), to obtain smooth homogeneous regions but preserve fine structures.
2.Clustering Algorithms
The goal of clustering is to partition an image set into a small number of groups or representative clusters. The fuzzy c-mean clustering algorithm seeks to find fuzzy partitioning by minimizing the following loss function:
where xi denotes the data vector (i=1, . . . ,n), n the total number of pixels, cj the center of a fuzzy cluster (j=1, . . . ,m), m the number of fuzzy clusters assumed to be known, µj(xi) the fuzzy membership of xi to cluster j. The parameter b>1 is a fixed value specified a priori. Typically b is chosen around 2. The necessary conditions for an optimal solution are
Performing differentiation and applying the constraint
leads to
Here dji denotes the Euclidean distance between the data vector and the cluster center.
The system of nonlinear equations can be solved by an iterative process, which is known as the FCM algorithm
1) Set number of clusters m and parameter b
2) Initialize cluster centers cj
3) Repeat:
Update membership values µ j(xi) via (4) using current estimates of cj and update cluster centers cj via (5) using current estimates of µ j(xi) until the membership values stabilize;
In FCM algorithm the noise and outliers in the data set create many spurious local minima and distort the solution that corresponds to the global minimum. Thus, a possibility c-mean (PCM) clustering algorithm was proposed by adding a term to the loss function
where nj denotes suitable positive numbers. Similar to the FCM algorithm the optimal solution can be achieved by iteration, using
This is done by alternating between the estimation of the cluster membership values (for the given values of cluster centers) and the estimation of the cluster centers (for the given membership values).
3. Classification Algorithm
Once the cluster centers have been estimated, the whole image set is classified by assigning labels to every pixel. The label, l=1, . . . m, is an integer value and represents classes. If the classification is carried out according to only the condition that the Euclidean distance between the data vector and the cluster center reaches a minimum, some regions appear somewhat mottled, with isolated pixels of one class embedded within larger regions of another class, i.e., mixed-up classes. Generally, one expects neighboring pixels to belong to the same class unless there is a true border between regions. Thus, we assume the field of labels is a Markov Random Field (MRF): the probability of a pixel to be labeled k knowing the labels of all other pixels in the image is equal to the probability of a pixel to be labeled k knowing the labels of its neighbors. The classification is realized by minimizing an energy function. It consists of its own energy U1 and energy U2 related to its neighborhood N. For each pixel, i, U1 and U2 are defined as
where ß is a weighting factor ( ß³0) and d is the Kroeneker symbol:
and N represents the neighborhood structure. Usually, the number of pixels within a neighborhood structure is predefined. The shape, in contrast, is not fixed, but is adapted to data. Here, the neighborhood structure is a 5*1 window with different orientations (shown in Fig. 1). One of the neighborhood structures is selected on which the variance of the data has the minimum value. Thus, by using the adaptive windows we take into account the local homogeneity and improve the detail preservation.
A classification is optimal if the global energy E over the whole image
is minimum. Global minimization is achieved by a simulated annealing approach.
Fig. 1 Neighborhood structures for classification algorithm
4. Simulated Annealing Algorithm
The concept of simulated annealing (SA) is based on an analogy between the thermodynamic behavior of solids and large combinatorial optimization. The basic procedure involves a cooling procedure, in which a þ temperature þ parameter starts out high and is gradually lowered until the system is þ frozen þ (in a state of minimal energy). In the simulated annealing algorithm, not only are state changes accepted which decrease energy, but also some state changes are accepted which increase energy with a defined probability. However, the lower the temperature, the less likely is any significant energy increase.
Simulated Annealing algorithm is implemented as follows
1) Choose initial temperature T0, assign the class label to every pixels randomly
2) Repeat
For each pixel, change randomly its label from class i to class j,
Compute DUij=Ei-Ej and accept the change,
when DUij 0, or, with a probability exp (-DUij/T), when DUij>0,
Tnew=u*Told (0 <u <1),
Until Tnew <Tend where Tend is the freezing temperature.
5. Results and Discussion
Multi-temporal ERS-2 SAR images over the Mekong river delta region, Vietnam, acquired on May 5, June 9, and July 14, 1996, respectively, are considered to test the algorithm. Their color composite image (RGB) is shown in Fig.2(a) (Liew, et. al., 1998). Each image has been processed as follows (Liew, et. al., 1998): (1) lowpass filter with a 5*5 averaging window; (2) downsampling to 50m pixel size; (3) adaptive Wiener filter; (4) 3*3 median filter. The cluster centers are calculated by applying FCM and PCM algorithms to the preprocessed data.
| cluster | C1 | C2 | C3 | C4 | C5 | C6 |
| Image 1 | 140.207 | 99.7053 | 0.17724 | 118.303 | 129.642 | 121.705 |
| Image 2 | 73.3753 | 89.6236 | 0.13534 | 111.192 | 126.289 | 149.934 |
| Image 3 | 82.252 | 84.6451 | 0.11518 | 98.9408 | 123.145 | 48.6108 |
Table 2. Cluster centers calculated by PCM algorithm
| cluster | C1 | C2 | C3 | C4 | C5 | C6 |
| Image 1 | 144.393 | 91.4003 | 0.00348 | 115.729 | 139.493 | 122.39 |
| Image 2 | 70.6142 | 83.862 | 0.00295 | 110.388 | 134.797 | 147.843 |
| Image 3 | 78.9161 | 78.9335 | 0.002914 | 103.892 | 128.79 | 51.5453 |
Table 1 and 2 show that the cluster centers calculated from the two algorithms are very similar. Comparing the individual values, the relative difference (|cFji-cP ji|/ cFji) is smaller than 7%. One exception is cluster 3 (c3), but it represents the same class in these two results, i. e., those pixels that have small values and change rarely. The close agreement of the cluster centers is probably due to the fact that the noise in the SAR images has been reduced effectively. Using the cluster centers calculated by FCM and the classification algorithm described above, we obtain the classification result shown in Fig. 2(b). False color represents different classes. Even though only 6 classes are used, the main characters of multi-temporal SAR images are highlighted. There are no mixed-up classes within the homogeneous regions, e. g., the regions represented by red and green. Meanwhile, a lot of fine structures, e. g., roads are preserved.
Fig. 2 (a) Color composite image of multi-temporal SAR images. (Red: May 5, Green: June 9, Blue: July 14, 1996)(Liew, et. al., 1998); (b) False color composite classified image.
In addition, we now apply this classification algorithm to a InSAR coherence image that is processed from two JERS single look complex SAR images. They were acquired on June 1 and October 11, 1996, covering a region of south Sumatra, Indonesia. Fig. 3(a) shows the InSAR coherence image. The bright region (high coherence) is bare land and the dark region (low coherence) is forest. If we classify the whole image into two classes, i. e., forest and bare land, the cluster centers can be determined interactively. The classification result is shown in Fig. 3(b). Despite the high noise in the coherence image, the bare land and forest can be delineated clearly. However, if the coherence image is classified only according to the cluster center without considering (neighborhood) texture information, the image can not be classified properly (shown in Fig. 3(c)), and the mixed-up of classes is very serious.
Fig. 3(a) In SAR coherence image. The bright pixels (high coherence) correspond to bare land and the dark pixels (low coherence) to forest; (b) InSAR coherence image classified into bare land (bright region) and forest (dark region); (c) InSAR coherence image classified without using (neighborhood) texture information.
6. Conclusion
A set of multi-temporal SAR images is considered to test the classification algorithm. Firstly, the cluster centers are calculated automatically by using fuzzy c-mean and possibility c-mean algorithms separately. The obtained cluster centers nearly agree with each other. Secondly, each pixel is classified into different classes by minimizing an energy function. This energy function contains cluster centers and the neighborhood information. The neighborhood is chosen based on the local homogeneity. Thus, the fine structures in the image are preserved, meanwhile, mixed-up classes in the homogenous regions are reduced effectively. Finally, this classification algorithm is applied to an InSAR coherence image. The whole image is classified into forest and bare land. A satisfactory result is obtained, even though the coherence image is very noisy.
7. Acknowledgments
The author would like to thank Dr. Liew and Ms. Chen, for providing SAR images after registration and speckle noise removal; and Prof. Nokayama at Tokyo University of Agriculture and Technology, for providing a sample of JERS raw data.
References
- Cherkassky, V. and Mulier, F., 1998. Learning from data: concepts, theory and method. John Wiley and Sons, Inc.
- Garzelli, A., 1999. Classification of polarimetric SAR images using adaptive neighborhood structures. Int. J. Remote Sensing, 20(8), pp. 1669-1675.
- Liew, S. C., Kam, S. P., Tuong, T. P. Chen, P., Minh, V. Q., and Lim, H., 1998. Application of Multitemporal ERS-2 synthetic aperture radar in delineating rice cropping system in the Mekong river delta, Vietnam. IEEE Trans. Geosci. Remote sensing Sensing, 36(5), pp. 1412-1420.
- Hegarat-Mascle, S. L. and Vidal-Madjar, D., 1996. Applications of simulated annealing to SAR image clustering and classification problems. Int. J. Remote Sensing, 17(9), pp. 1761-1776.
- Wong, Y. F. and Posner, E. C., 1993. A new clustering algorithm applicable to multispectral and polarimetric SAR images. IEEE Trans. Geosci. and Remote Sensing, 31(3), pp. 634-644.