| GISdevelopment.net ---> AARS ---> ACRS 1999 ---> Poster Session 4 |
Discriminant analysis of
polarimetric SAR data for coastal land cover feature detection
Randy John N. Vinluan,
Enrico C. Paringit and Epifanio D. Lopez
Department of Geodeteic Engineering, College of Engineering
University of the Philippines, diliman, Quezon City 1101
Fax: (63 2) 920 –8924
Email:rjnv@engg.upd.edu.ph
AbstractDepartment of Geodeteic Engineering, College of Engineering
University of the Philippines, diliman, Quezon City 1101
Fax: (63 2) 920 –8924
Email:rjnv@engg.upd.edu.ph
Polarimetric synthetic aperture radar over the coastal province of Iioilo in the Philippines was acquired by the NASA AIRSAR mission in November 1996. For the study, an image of nine bands, consisting of C-, L- band frequencies at HH, VV and HV polarizations were considered for analysis. An image transformation method was applied to an 800 pixel x 700 line subset of the image for subsequent identification of coastal land cover features. This method, discriminate analysis, was a multivariate statistical technique which maximizes the separation of groups based on a set of measurements. The transformed image was classified and then compared with the result obtained by using the ‘conventional’ maximum likelihood classifier. A classification accuracy rate of 84.56% was achieved using discriminate analysis and 84.78% using the maximum likelihood algorithm alone. The results showed that there was no significant difference in the performance of discriminate analysis and maximum likelihood algorithm in the identification of land cover features.
Introduction
Experience with single band synthetic aperture radar (SAR) data tells us that, despite knowledge of radar backscatter mechanisms involving the radar beam and natural objects on the ground, performing land cover classification is difficult, to say the least. In order to overcome this inherent difficulty, literature suggests that we do integration with optical data, analysis of multi-data SR imagery and derivation of other parameters such as texture and fractal dimension in order to achieve an acceptable rate of classification accuracy. The advent of polarimetric synthetic aperture radar (SAR) presented an opportunity to ground targets using three radar frequencies and four polarizations. In late 1996, the National Aeronautics and Space Administration of the United States deployed the airborne SAR imagery have been acquired for several test sites and are now being utilized for various applications including geologic mapping, volcanic studies, land cover mapping, rice crop monitoring and mineral exploration. This paper reports on our experience in analyzing AIRSAR data for the identification of land cover types in a small coastal area in a rapidly-developing province in the central part of the Philippines called Iioilo.
The general objective of the study is to evaluate a multivariate statistical technique called discriminate analysis in terms of its ability to “discriminate” between several pre-determined land cover classes. In particular, the study seeks to (a) determine which individual radar bands make up the land cover discrimination model and how much each individual band contributes to the model: (b) do the same using radar bands grouped According to frequency and polarization; and 9c) compare the results of discriminate analysis with that obtained using the “conventional “ maximum likelihood algorithm.
2. Methods
2.1 Data preparation
An AIRSAR strip has a size of about 10 km by 60 km. From this strip, an 8 km by 7 km sub-scene was extracted. This sub-scene covered the coastal areas in the provinces of Iiolio and Guimaras, separated by the Iioilo-Guimaras strait. The digital numbers were convered to dBs, after which a 5 x 5 Lee filter was applied. Rectification was done using only in the x and y directions since the study area was relatively flat anyway. From this sub-scene, 12 land cover classes were identified. These were calm water surface, rough water surface, wet fish ponds, dry fish ponds, newly-planted rice, mature rice, residential areas other build-up areas, grasslands, mangroves, forested areas and bare soil. Training patches corresponding to each of the land cover types were defined on the image. After that, 300 points were randomly selected from each class. This was done in order to ensure that the effects of spatial autocorrelation and other effects associated with a pixel-based classification are reduced. Half of the number of points were used to train the classifiers while the remaining half were used as test data. The study assumes “reciprocity”, that is HV-VH, and thus, only nine of the 12 bands are used in the analysis.
2.2 Data analysis
Discriminate analysis is an image transform which has roots in statistics. It is performed in order to describe the inherent separation existing between two or more variable, in this case, land cover types, based on a set of observations (radar backscatter values). It does this by computing a number of discriminate functions equivalent to the number of variables. These functions are essentially are that the data follows a multivariate normal distribution and that the variance-covariance matrices for the number of classes are statistically equivalent. However, violations of these assumptions do not lead to “fatal” results.
The procedure for the two-group case is described. We are given samples x1, x2, … xn and y1,y2…, yn. with group mean vectors of m1 and m2 respectively and a population covariance S. Each vector (x1 and y1) consists of measurements on a given number, say p, of variables. The discriminate function is the linear combination of these p variables that maximizes the distance between the two transformed group mean vectors. These functions take on the from:
Z2 = a’x = a1y1 + a2 y2 + ….. + anyn
Discriminate analysis is concerned with finding the vector a that will maximize the standard difference between the means of z1 and z2. The maximum occurs when :
Using Fisher’s linear classification procedure, a particular sample, say k, is then assigned to the first group if a’ k is closer to the mean of z1, or to the second group if a’ k is closer to the mean of z2. The procedure described above is extended discriminate between 12 land cover classes using nine independent polar metric radar measurements. The training data is then re-arranged according to polarization and radar frequency and same technique was applied to the new data. This is done in order to determine the significance of radar polarimetry and frequency in land cover feature detection. The results are then compared with that obtained using the “conventional” maximum likelihood algorithm.
3.Results and discussion of results
3.1 Discriminate analysis of all variables
A forward stepwise selection of input variables was performed in order to determine which variables contribute significantly to group separation as well as to eliminate variables that are redundant. However, it was found that all nine variable contributed significantly to group separation. This may be due to the fact that the different polarizations and radar frequencies are important in the detection of different land cover types, such as L-band for agricultural cover, P-band for soil cover and cross-polarized L-or P-band for forest cover. The variables PHH, CHH, CVV, LHH, CHV, PVV, PHV, LHV and LVV were entered in that order. The standardized coefficients of the discriminant functions are shown in table 1. the contribution of a variable to group separation may be inferred from the magnitude of the coefficients. The first function, which accounts for 70 per cent of group separation is dominated by CHH, PHH, CVV and CHV. The second function, which accounts for 8 per cent of group separation, is dominated by PHH, LHH, LHV and PVV. The first three discriminate functions already account for 91 per cent of the group separation. In the first three discriminate functions, all variables, except for LHH, contribute significantly to group separation. LHH actually dominates the higher-numbered functions.
Table 1 Standardized coefficients of derived discriminate functions
| f1 | f2 | f3 | f4 | f5 | f6 | f7 | f8 | f9 | |
| CHH | 0.42 | -0.09 | -0.30 | -0.62 | -0.06 | 0.60 | 0.05 | 0.14 | -0.51 |
| CHV | 0.25 | .1 | -0.09 | -0.50 | -0.26 | -0.64 | -0.12 | -0.19 | 0.62 |
| CVV | 0.32 | 0.39 | 0.13 | 0.40 | -0.05 | 0.53 | 0.00 | -0.54 | 0.28 |
| LHH | 0.14 | -0.03 | -0.55 | 0.68 | 0.58 | -0.39 | 0.19 | 0.04 | -0.14 |
| LHV | 0.04 | -0.15 | -0.45 | 0.51 | -0.59 | 0.06 | -1.15 | 0.55 | 0.01 |
| LVV | 0.10 | 0.09 | -0.02 | 0.08 | -0.07 | 0.21 | 0.44 | 0.74 | 0.44 |
| PHH | 0.32 | -0.23 | 0.66 | 0.19 | -0.37 | -0.23 | 0.97 | -0.13 | -0.74 |
| PHV | 0.4 | -0.85 | 0.32 | -0.35 | 0.60 | 0.14 | 0.05 | - 0.38 | 0.65 |
| PVV | 0.05 | 0.51 | 045 | -0.20 | 0.62 | -0.03 | -0.33 | 0.39 | -0.28 |
|
| |||||||||
| Discriminating power | 60.63 | 11.19 | 6.83 | 4.28 | 1.78 | 1.14 | 0.26 | 0.26 | 0.01 |
| Per cent | 70.40 | 12.99 | 7.94 | 4.97 | 2.02 | 1.33 | 0.30 | 0.04 | 0.01 |
| Cumulative per cent | 70.40 | 83.39 | 91.33 | 96.30 | 98.32 | 99.65 | 99.95 | 99.99 | 100.0 |
The image defined by the first three discriminate functions are shown in figures 1a to 1c. In the first discriminate function, the 12 land cover classes appear distinctly. The water areas are clearly differentiated from the non-water areas. Wet and dry fish ponds are also differentiable. Urban areas appear bright in contrast with other land features which appear in several gray tones. Mature and young rice paddies are shown in bright and dark patches respectively into upper left portion. The lower right portion of the image represents the forested forested areas in Guimaras province which have a textured appearance. The second discriminate function is observed. The image has a coarse appearance which obscures the water-land boundary. The land cover features are no longer easily detectable. Nevertheless, dark patches appear in the upper left quadrant of the image representing rice paddies, grassland and bare soil. The third discriminate function is again dominated by negative loadings. Other than the water body, urban areas appear very bright in contract with the other land cover types. The individual fish ponds are still recognizable unlike other linear features such as roads, the outline of rice paddies and the river.
Fisher’s linear classification procedure is applied to the test data. The classification procedure yielded an overall accuracy rate of 84.56 per cent, or kappa coefficient of 0.83 . The result is shown in table 2. the classified image is shown in figure 1d. A high accuracy rate (>85 per cent) was achieved for the classification of rough water surface, mature and young rice, other built-up areas, grass, mangrove and bare soil. Most calm water pixels were classification as rough water and wet fish pond while pixels corresponding to residential areas were classified as other built-up and forested areas. The former may be due to variations in dielectric properties in the individual pixels making up the training areas for calm water while the latter may be due to variations in texture in the individual and neighboring pixels making up the training areas for residential areas.
Table 2 Result of the classification of the test data
| RW | CW | CD | DF | MR | YR | OB | RA | F | C | M | BS | ||
| LDA | 150 | 71 | 124 | 146 | 137 | 145 | 128 | 92 | 113 | 133 | 136 | 147 | 1522 |
| C | 67 | 87 | 122 | 113 | 126 | 147 | 124 | 83 | 68 | 95 | 81 | 137 | 1250 |
| L | 150 | 7 | 125 | 96 | 53 | 98 | 38 | 74 | 53 | 115 | 110 | 118 | 1037 |
| P | 63 | 0 | 56 | 121 | 104 | 70 | 60 | 93 | 108 | 133 | 129 | 131 | 1068 |
| HH | 146 | 23 | 129 | 139 | 101 | 139 | 39 | 65 | 45 | 134 | 138 | 141 | 1229 |
| HV | 150 | 1 | 53 | 106 | 110 | 95 | 45 | 28 | 43 | 124 | 100 | 142 | 997 |
| VV | 44 | 101 | 34 | 106 | 64 | 105 | 130 | 82 | 82 | 85 | 38 | 70 | 941 |
| MLD | 131 | 128 | 119 | 145 | 142 | 122 | 136 | 81 | 138 | 120 | 126 | 138 | 1526 |
LDA = linear discriminate analysis; C = C-band-grouped; L = L-band-grouped; P=P-band-grouped; HH=HH-polarization –grouped; HV = HV-polarization-grouped; VV=VV-polarization-grouped; MLA = maximum likelihood algorithm; RW = rough water; CW = Calm water, WF = wet fish pond; DF = dry fish pond; MR = mature; YR = young; OB = other build-up areas; RA = residential areas; F = forest; G= grass; M= mangrove; BS = bare soil
3.2 Discriminate analysis of grouped variable
Table 2 likewise shows the result of the classification using only a subset of the variables grouped according to polarization and radar frequency. The most obvious observation is that the number of correctly classified resulting from the discriminate analysis of the grouped variables are considerably les than when all variable are considered. This highlights the importance of polarimetry in land cover discrimination.
With its small wavelength, C-band radar, which is found in the ERS and Radarsat satellites, is found to be useful in the classification of micro-textured land cover classes such as bare soil, build-up areas and rice. Classification using C-band yields and accuracy of 69.4 percent, or a kappa coefficient of 0.67. P-band radar, being longer, is found to be useful in detecting forested areas, grasslands and mangroves – which are all volumetric scatterers. It is not useful in useful in detecting areas covered by water such as clear fishponds and seawater. Classification using P-band yields and accuracy of 59.3 per cent, or a kappa coefficient of 0.56.L-band performs better than the two in detecting rough water and clear fishponds but worse in detecting the rest. Classification using L-band yield an accuracy of 57.7 per cent, or a kappa coefficient of 0.54.
When the variables are grouped according to polarization, it seems that HH polarization performs better and more consistently in detecting land cover features than the other two polarizations by a least 13 per cent. VV polarization is more useful in the detection of urban features and forests while cross-polarization is useful in detecting bare soil and rough water. Classification using HH, HV and VV polarizations yield overall accuracy rates of 68.3 per cent, 55.4 per cent and 52.3 respectively.
3.3 Comparison with the maximum likelihood algorithm
Table 2 also shows the results of classification by maximum likelihood algorithm. An overall accuracy rate of 84.78 per cent, or a kappa coefficient of 0.83 was achieved. Overall, this method is a slightly better classifier than discriminate analysis. However, it performed better in the detection of only four out of 12 classes. However, the difference in classification performance, at least, between discriminate analysis and the maximum likelihood method is not statistically significant. The classified image is shown in figure 1e. Despite this equivalence in classification performance, more information may be derived by using discriminate analysis which may improve the results of automatic classification. These information relate to the statistical description of individual land cover classes, inter-band correlation and variance, and other statistical parameters.
4. Conclusion
The study evaluated the performance of the discriminate analysis technique in the identification of coastal land cover features in polarimetric SAR imagery. The results were then compared with that obtained using the ‘conventional’ maximum likelihood algorithm. It was found that all bands in the polarimetric SAR data contributed significantly to the discriminate model. The first three discriminate functions explained 93 per cent of the discriminate between the 12 land cover classes identified. The 12 classes were evident in the image defined by the first discriminate function. Classification by discriminate analysis and maximum likelihood yielded an accuracy of 84.56 and 84.78 per cent respectively. There was no significant difference between the classification performance of the two methods.
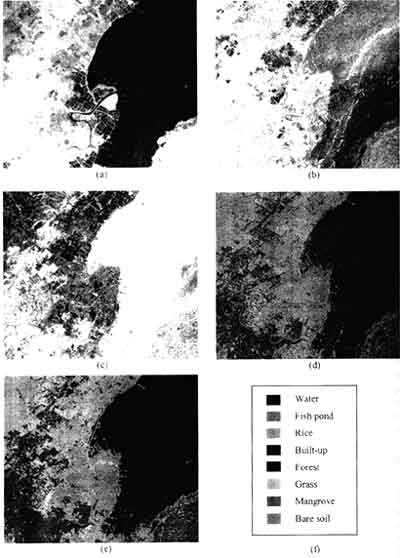
Figure 1. Images defined by (a) discriminate function 1. (b) discriminate function 2 and (c) discriminate function 3; (d) classified image using discriminate analysis; (d) classified image likelihood; (f) legend for (d) and (e)