| GISdevelopment.net ---> AARS ---> ACRS 1999 ---> Poster Session 4 |
Comparative Study of
Positional Accuracy Evaluation of Line Data
Yoshiaki Kagawa, Yoshihide
Sekimoto and Ryosuke Shibaski
Center for Spatial Information Science and
Institute of Industrial Science,
University of Tokyo
4-6-1 Komaba, Meguro-ku, Tokyo 153-8505, Japan
Tel: +81-3-5452-6417 Fax: +81-3-5452-6417
Email:-kagawa@skl.iis.u-tokyo.ac.yp
Key wordCenter for Spatial Information Science and
Institute of Industrial Science,
University of Tokyo
4-6-1 Komaba, Meguro-ku, Tokyo 153-8505, Japan
Tel: +81-3-5452-6417 Fax: +81-3-5452-6417
Email:-kagawa@skl.iis.u-tokyo.ac.yp
Line data, positional error, evaluation method, comparative analysis
Abstract
Recently, geographic information system (GIS) is used in a variety of fields. Spatial data is not usually free from errors and uncertainties, and they may have serious impacts on results of spatial query and analysis. In order to understand and evaluate these influences of errors and uncertainties, the quality of the spatial data needs to be evaluated quantitatively. In case of point data, it is easy to define the positional deviation or errors. But with regard to line data such as road boundary, not many measures or indicators have been proposed to characterize the positional error. In this study, the authors propose several measures to evaluate quantitatively the positional errors of line data, and compare the measure including the existing ones using actual data.
1.Introduction
Recently, geographic information system (GIS) is used intensively in a variety fields. And it is possible to acquire geographic data from various data sources. But, the data from different data sources are not always consistent due to errors. There are many sources of errors; e.g. errors from difference of primary acquisition methods, errors of digitizing, and errors from the lack of revision. It is important that we know what errors the data contain, and for that purpose, it is necessary to provide a set of methods for quantitative evaluation and to allow users to select evaluation methods according to their needs.
In the case of point data, we can easily evaluate the error by measuring root mean square error between corresponding point data. But in the case of line data, it is hard to identify the corresponding points. In this study, we propose evaluation methods for positional errors of line data, apply them to actual line data, clarify their characteristics.
2. Evaluation methods
Line data is represented by a series of point data. In the case of point data, we can identify which point data we measured. In the case of line data, however, we cannot identify which specific points along the line are measured. That is, it is difficult to identify the correspondence between "true" point and measurement point. The following sections describe proposed and existing methods for evaluation.
2.1 Buffer method
Buffer method was proposed by Shibasaki (shibasaki, 1992) based on Peucker's e model. (Peucker, 1976) And Goodchild shows that distribution of errors make Gaussian distribution with this method (Goodchild, 1997). Consider a buffer of width e around the true lie, then we search e that contain a certain proportain (e.g. 95%) of measurement line's length within the buffer (Fig 1). This method investigates in how degree of range from true line measurement points exist, and does'nt, and identify errors explicity on the point-to-point basis. Consequently, it is difficult to compute likelihood of a line passing certain place. And bias of errors is difficult to estimate with this method. At the same time this method is insensitive to large errors from blunder.
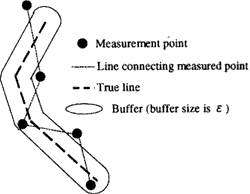
Figure 1: Evaluation using buffer method
2.2 Pont-correspondence method
In applying point-correspondence method, virtual measurement points are generated along the measurement line with constant interval and "virtual error vectors" are drawn connecting the virtual points on the measurement line and "virtual points" along a "true" or reference line. The "virtual measurement points" on the true line are determined so as to minimize the total sum of square length of the virtual error vectors. This method is based on assumption that aperture generate nodes of a measurement line to minimize "overall" errors or maximinze agreement between the true line and the measurement. In evaluating the "overall" errors or agreement, we assume that the operators generate "virtural" check points along the measurement line or the true line with constant interval interfal to evaluate distance or errors between the true line and the measurement (Fig2). To put it concretely, this method follows the bellow procedures.
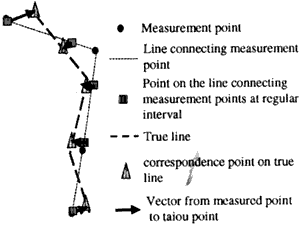
Figure 2: Point-correspondence method
- Generate "virtural" check points along the measurement line with constant interval.
- From the virtual points, draw error vectors to true or reference line.
- Determine or adjust the end or error vectors on the true line to minimize total square of length of vectors.
- In the minimization process, set constraint conditions that order of the end points of the error vectors on the measurement line should be consistent with the order of another end points on the true line.
2.3 Hausdorff distance
Suppose that e1 is width of buffer from the true line which contains all of the measurement line, and that e2 is width of buffer from the measurement line which contains all of the true line. Min {e1 , e2 } is called hausdorff distance. Since width of buffer that contains all length of the line, it is sensitive to large errors.
2.4 Elimination of bias-error elements
Methods proposed above are for evaluating random errors and not for evaluating systematic errors, for instance, bias, rotation, and difference of scale. So it is necessary to eliminate them. With point-correspondence method, we can estimate systematic errors.
3. Case study
In his study, we use two types of road data of Sagamihara city in Kanagawa prefecture from different data sources. One is data from digitized road ledger (1/500 scale), which is regarded as a reference data, and another is data from aerial survey (1/2500 scale), which is regarded as a measurement line. We picked a part of these data and evaluated errors using proposed methods.
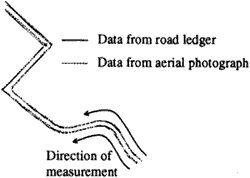
Figure 3: Sample road data
3.1 Buffer method
Result is shown in Fig4. X-axis denotes width of buffer and Y-axis is proportion of length within the buffer. Total length of road boundary data is 706.8 m. Then when 95% of length of measurement line is within buffer, width of buffer is 1.99m. When the distribution of errors makes Gaussian distribution, estimated result is shown at Fig. 4. It seems to be similar to the result of the sample. But bias cannot be estimated with this method.
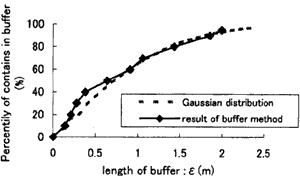
Figure 4: Result of buffer method
3.2 Point -correspondence method
We generated 100 points along with a constant interval, and generated vectors to the true line so as to minimize the sum of squared length of the vectors. Errors of each point are shown at Fig5. Positive values of Y-axis denote the left side against the direction of measurement. And Fig6 shows frequency of range of errors. We can suppose that errors are biased to the left side of the reference 1/500 line. Average of bias is 0.68 m.
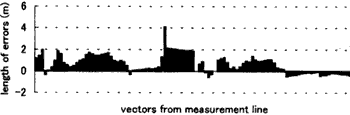
Figure 5: Result of point-correspondence method
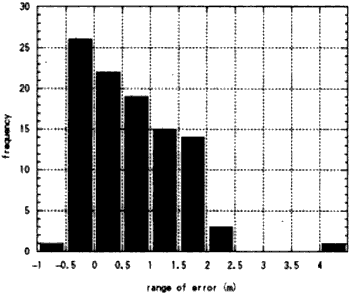
Figure 6: Frequency about range of error
3.3 Hausdorff distance
Width of buffer from the true line is 4.3m, and width of buffer from the measurement line is 5.8m. So, Hausdorff distance is 4.3m in this case. Difference of them may result from mismatch at their edge. Hausdorff distance is the longest vector in Fig8.
Conclusions
We evaluated positional errors of road data (line data) with proposed and existing methods. Table 1 summarizes the characteristics of the methods obtained from the results of the case study.
| Buffer method | Point-correspondence method | Hausdorff distance | |
| Data quality measure | Width of buffer in which a certain percentile of length of measurement line is included | Length of vector from measurement line to true line (total length is minimized) | Smaller buffer which contains all length of another |
| Characteristics | - From distribution of width
of buffer and percentile, approximate accuracy can be supposed. - Insensitive to large errors from blunder. - Bias of cannot be estimated. | - From distribution of error
vector, bias can be estimated. - Distribution of errors can be estimated exactly. | - Max error can be
estimated. - Sensitive to large errors from blunder. |
But, to establish an evaluation system to fulfill needs of user, the variety of methods for evaluation is not sufficient. In addition, the combination of the methods needs to be examined. Finally, these methods need more through examination by applying the methods to a variety of data.
References
- Goodchild, M., Hunter, G., 1997. A simple positional accuracy measure for linear features, International Journal of Geographical Information System, 11, 299-306 Peucker, T., 1976. A theory of the cartographic line, International Yearbook Cartography, 134-143.
- T, Kadowaki, and R, Shibasaki., 1992. Measurement and evaluation of positional error of line data in digital map. Journal of proceedings of the Conference of Japanese Society of Photogrammetry and Remote Sensing, 71-76.