| GISdevelopment.net ---> AARS ---> ACRS 1999 ---> Poster Session 3 |
Vegetation Phenological
Variation Monitoring by Meteorological Satellite
Xiao Qianguang, Xiao Lan,
Chen Weiying and Guo Liang
National Satellite meteorological Center
China Meteorological Administration, Beijing, 100081, China
Key words: phenology, vegetation index,
climatic variations, remote sensingNational Satellite meteorological Center
China Meteorological Administration, Beijing, 100081, China
Abstract
This paper is about the monitoring method of early stage signals of environmental and climatic variations. Because environmental (climatic) variation and vegetation variations have bi-directive indicate effects, hence the vegetational variations are reflected by the vegetation index NDVI in remote sensing image. Thus the vegetation index NDVI is an important indicator in measuring environmental changes caused by globe warm effect. Based on the monitoring result obtained through meteorological satellite last decade (1989-1998), we come to the conclusion. The vegetation index changes, especially greatly in spring, which is very obvious in north and northeast China.
Preface
Resources, environment and population are the three hottest in the current world. Deterioration of globe environment challenges the whole world greatly. In order to prevent its further deteriorating, scientists of multiply subjects all over the world are making researches on global environment changes, and trying to find out the causes of deterioration to prevent it. These studies include routine field observation and model estimation as well. Due to the limitation of observation stations and spots, and the random feature of estimation model factor, it Is hard to overview the whole aspect of environmental changes. Along with the progress of space technology, and the maturity of remote sensing technology, it is getting possible to carry out a consecutive, overall and dynamic monitoring of the whole world environmental changes. This monitoring covers land utilizing changes, dynamic changes of vegetation growth, and energy, water balance procedure, and so on. Since vegetation and environment (climate) can reflect and indicate each other, this article is trying to seek out early stage signals of environment changes at vegetational remote sensing method. Using current climate models (GCM model), we can know the mean temperature of China will increase by 1.5 to 4.5 centigrade, if double the content of Carbon Dioxide. Temperature increase will cause vegetational phonological change, this change can be reflected clearly in remote sensing images, while it is difficult to express directly in GCM model. Based on vegetation remote sensing image of China obtained through meteorological satellite last decade, the monitoring result of vegetational phenology is described in this article. In order to reflect the consecutive changes in our research work, we carried out a series of special processing method to deal with the meteorological satellite data.
1) Vegetation index processing method
The high calculation precision must be ensured in accomplishing remote sensing monitoring of climatic change, so we need to carry out a series of processing work. The definition of NDVI is a follows.
NDVI = (CH2-CH1)/(CH2+CH1)
Where, NDVI is vegetation index, CH1, CH2 is the reflectance of channel 1 and channel 2 of NOAA/AVHRR, respectively. The values of NDVI undulate greatly due to the influence of water vapor and aerosol of atmosphere. We use MVC method to get as mush as possible cloudless sky NDVI data to exclude these influences. We need to calculate the TNDVI of every ten-day out to get phonological changes, that is:
TNDVI = MAX[NDVI {t = 1,2,3,….10)
in the above equation, t is the number of days, and TNDVI is the maximum value of ten-day. Because the value of NDVI will be low when it is cloudy or in turbid atmosphere situation. We use this maximizing value method to remove the influence of cloud in most cases. But in summer or raining season, it is really difficult to get ten -day cloudless NDVI data, and the existence of cloud shields the information of vegetation, the NDVI value of this ten-day will be rather low. We have to remove the cloud influence to obtain the correct NDVI data of this ten-day by using three points insert value method. For example, if it is fully cloudy in the 2nd ten day of one month, we should insert a value between Ist and 3rd ten- day data of the month, and then maximize, that is:
TNDVI (N) = max (TNDVI (N+1) + TNDVI (N-1)/2, TNDVI(N)].
In the above equation. N is number of ten-day (36 ten -day per year). N can range from 1 to 36. For example, if the mean value of Ist and 3rd ten-day is greater than the value of 2nd ten-day, the mean value will replace the value of 2nd ten-day. After this Processing, in summer or raining season, NDIV data can be modified to some extent. We carry out a dynamic monitoring in a specified area in serial years by NDVI smoothed by every ten-day of every year. This monitoring can reveal the TNDVI change regularity of normal climate year and the NDVI exceptional phenomenon of abnormal year.
II) Remote Sensing Monitoring of Vegetation phonological variations.
Based on the processing method described above, we obtain the vegetationindex images of every ten-day of China (including peripheral area), and then sum up the vegetation index of every ten-day of every month, thus get the vegetation index image of every month. NDVI maps are formed by ordering these images by time sequence (month, season, and year). Because the environmental changes and vegetation changes can reflect and indicate each other, we can analyses the changes of environment from these images. By analyzing the vegetation index images from 1989 to 1999 (fig., omitted), we can see its uptrend although NDVI undulate a little between years. By analyzing the vegetation index image in April of 1989, 1993, 1998 (fig.1, fig.2, fig.3), we can see the value of NDVI increase gradually and obviously year by year in most areas of China, particularly in north China. The change of later 5 years is greater than former 5 years; By analyzing the vegetation index images of north east Asia (fig. 4, fig.5), the greatest vegetation change areas from 1989 to 1998 are including north China, LiaoNing, JiLin, HeiLongJiang.Korean peninsula and Russian Baikal lake area. It is hard to discern whether this change is the inherent character of natural change, or is caused by the human activities. But many scientists think that the massive burning of mineral causes the increase of Carbon Dioxide, and warm effect increase temperature. The result from meteorological observation station shows meteorological observation station shows that the increase of air temperature often occurs in winter and spring. The change of temperature cause the vegetation phonological changes. Vegetation grows rather slowly in winter, it is hard to reflect the change of vegetational phenology; while in spring, vegetation is sensitive to temperature, thus the change of vegetational phenology shows very clearly in remote sense image.
III) Conclusion
- Vegetation index NDVI is an important indicator in measuring environmental changes caused by globe warm effect.
- The monitoring result obtained through meteorological satellite last decade (1989-1998) shows that the vegetation index changes, especially greatly in spring, which is very obvious in north and northeast China.
- Xiao Qianguang, and Chen Weiying, 1991, Stuy on Montoring Vegetation Ecological vegetation index from meteorological satellit. (Environment monitor and crop yield estimate) Peking university press.
- Xiao Qianguang etc, 1997, Monitoring the ecological transect in east Asia monsoon region by meteorological satellite remote sensing. (Acta Botanica Sinica) 1997, 39(9): 826-830
- Xiao Qianguang,Chen WeiyingL Estimating the net primary productivity
in China using meteorological satellite data (Acta Botanica Sinica)
1996, 38 91) :35-39.
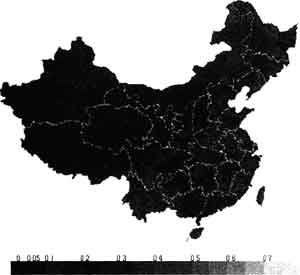
Figure 1: China vegetation index of April, 1989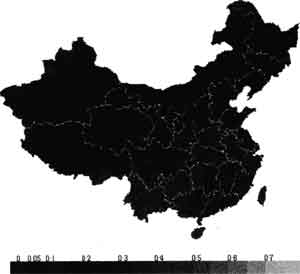
Figure 2: China vegetation index of April, 1993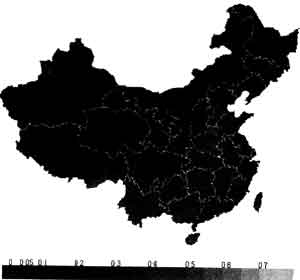
Figure 3: China vegetation index of April, 1998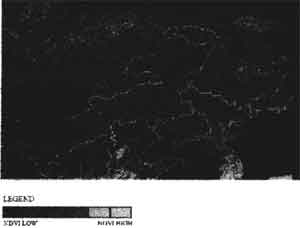
Figure 4: North Asia vegetation index of April, 1989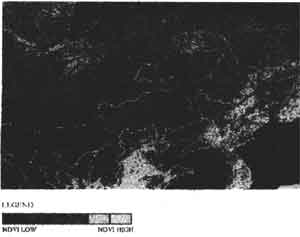
Figure 5: North Asia vegetation index of April, 1998