| GISdevelopment.net ---> AARS ---> ACRS 1999 ---> Poster Session 3 |
Methods for Assessing the
Quality of A Digital Elevation Model Generated using Full-Scale Images
Dr. S.A.B. KIM* Dr.wonyou
PARK , Prof. Tag-Gon KIM**
*Satellite Technology Research Center,
**Dept. of Electrical Engineering,
Korea Advanced Institute of Science and Technology,
373-1 Kusung, Yusung, Taejeon, S. Korea 305-701.
Tel: +82-42-869-8634. Fax: +82-42-861-0064.
Email:-sbkim@krsc.kaist.ac.kr
Keywords*Satellite Technology Research Center,
**Dept. of Electrical Engineering,
Korea Advanced Institute of Science and Technology,
373-1 Kusung, Yusung, Taejeon, S. Korea 305-701.
Tel: +82-42-869-8634. Fax: +82-42-861-0064.
Email:-sbkim@krsc.kaist.ac.kr
digital elevation model, accuracy assessment, geodetic datum
Abstract
The most viable way to assess the quality of a digital elevation model, (DEM) generated from satellite images would be to compare with digitized map. Complexity in quality assessment (QA) arises due to difference in geodetic datum: the most accurate DEM from satellite images requires WGS84 (World Geodetic System) datum whereas the digitized maps are given on a local datum (Tokyo Mean datum for Korea). This complexity has not been addressed so far. How much the datum difference may impact QA results is investigated in this work. The test region is 30 km by 40 km area in Korea, and a DEM is generated from 10-mresolution SPOT satellite images. QA is performed, first, on WGS84 datum. Second, QA is performed on Tokyo Mean datum and the difference between the two QA results are analysis. The rootmean-square (RMS) of the differences over the entire test site is merely 4.5 cm (252,000 grid cells). There are, however, spots with significant difference. At 24 grid cells the difference is > 0.5 m. The RMS of their difference is 4.6 m. Correlation analysis supports that steeper terrain and the horizontal distance between the two datum lead to greater difference between the two QA methods. Since most countries use non-WGS84 local datum, the results from this study can be applied universally.
Introduction
A digital elevation model (DEM) is the most effective medium for terrain analysis and constructing geographical information system on a large scale (e.g., Moore et al., 1991). An essential step in DEM production is the assessment of DEM quality. A coomonly-used method for such assessment is to compare with digitized maps. GPS (global positioning system) measurement, an alternative, suffers from insufficient sampling of terrain though by far more accurate than digitized maps.; Complexity in the quality assessment (QA) arises due to difference in geodetic datum. That I, when satellite images are used, the datum of the most accurate DEM would be WGS84 (World Geodetic System). This is because such DEM would require ground control points to be obtained by GPS measurements and GSS84 is the datum of GPS records. Whereas the digitized maps are given ona local datum (Tokyo Mean datum for Korea). This complexity has not been addressed so far. Nor has been the issue of how much the datum difference may impact QA result, thus the issue is investigated in this work.
Limitation of using GPS Recores as Truth Data
It is demonstrated the GPS records are not appropriate as truth, due to sampling deficiency of the measurements. The sampling deficiency issue was hinted by previous authors (Sasowsky et al., 1992) but not in the context of comparisons using GPS records, nor in a quantitative manner. To demonstrate this, three sets of differential GPS measurements are compared with 3"-DTED (digital terrain elevation data) over S. Korea (NIMA, 1999). The GPS data are: (a) 31 records measured by Korean National Geographic Institute (NGI). These are evenly distributed over S. Korea, thus would be less biased to any particular terrain type (b) 161 records measured using a Trimble receiver over about 100 km by 200 km region (c) the same method as in (b), but 25 records over about 60 km by 60 km region.
The difference between DTED and GPS over the three regions are -1 m, -17 m and 20 m (Table 1). Closer examination reveals that the magnitude of the mean error is due more to the sampling deficiency than to the actual difference between GPS and DTED (Kim et al., in preparation). Another way of explaining the sampling deficiency in GPS measurement is by the Nykist criterion. The characteristic wavelength of a terrain is about 300 m, after the variogram analysis by Collins and Woodcock (1999) of 30-m resolution Landsat image over 24 by 24 km forest region in Oregon. The GPS records should has a horizontal resolution of O(2), which is impractical. Since the only feasible source with sufficient sampling is the digitization of a conventional map.
| Area | GPS - (DTED+geoid(m) | |
| Mean | SD (m) | |
| A | 1.3 | 6.5 |
| B | -17.3 | 11.0 |
| C | 19.6 | 9.3 |
Data
A SPOT DEM is generated using a stero-pari, taken on Oct. 20, 1997 and on May 22, 1998. The area covered is of about 60 km by 60 km. Stereo-matching is an area-based one using the epipolar correlation criterion (Lee et al., 1999). To save computing time, stereo-matching is performed at every 5 pixel, thus the output resolution is 50m. 528,254 points are matched out of 1,440,000 grid (Fig.1). The coverage is somewhat low because in the southern two-fifth of the region,there are no GCPs. In the Northwestern and Southeastern parts of the region, the terrain is flat at elevation less than 200 m. In the Northeastern and Southwestern parts, there are mountains with elevation ranging from 200 m to 1000 m, which occupy about 40% of the entire region.
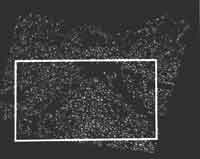
Fig. 1. Stereo-match results automatically generated a SPOT stereo-pair over a 60 km x 40 km region in s. Korea. White (black) regions indicate match success (failure). The large box defines the boundary of a digitized DEM.
The reference DEM used during the QA is obtained by digitizing 1:50,00 maps produced by NGI given relative to Tokyo Mean Datum. An area of 40 km by 30 km was selected (Fig. 1). The resulting map is interpolated and given at 60 meter resolution.
Methods
QA is performed, first, on WGS84 datum: that is, to convert latitude, longitude, and elevation of a digitized map on Tokyo Mean datum into those on WGS84 datum. Second, QA is performed on Tokyo Mean datum by converting the SPOT DEM on WTS84 datum. The differences between the two QA results are schematically displayed in Fig.2. In more detail, taking an example of the QA on the Tokyo Mean datum.
Fig. 2 Schematic diagram for difference between elevation data sets posted relative to different geodetic datum. The lines A-B and A-E indicate the elevation difference computed on WGS84 datum (lWGS84) and Tokyo Mean datum (lTokm) respectively. Thick curves describe DEMs and thin curves ellipsoids of two datum.
- transform the SPOT camera-model output in WGS84 Cartesian Coordinate (XWGS84, YWGS84, ZWGS84) to Tokyo Mean datum Cartesian coordinate (XTokm, YTokm, ZTokm)
- convert XTokm, XTokm, ZTokm, to the geodetic latitude (fTokm), longitude (lTokm), and ellipsoidal height (hTokm), [Featherstone and Dentith, 1998]
- obtain orthometric height (HSPOT), such that HSPOT = HTOKM - geoid
- project the geodetic coordinates of the Transverse Mecator coordinate, since the 1:50,000 map is given in TM coordinate (TMx, TMy)
- extract the bilinear interpolation of four elevation data adjacent to (TMx, TMy)
- the difference (DTOM) between HSPOT and Href is regarded as the error in the SPOT DEM on Tokyo Man datum.
Insignificant difference on a full scale
The errors in the SPOT DEM computed on the two dtum (DTOM DWGS84) differ by 4.5 cm TMS, assessed over 252,000 grid cells. This difference would be negligible compared with the magnitude of the errors themselves: 65 m RMS in this region on WGS84 datum (even the best algorithm at the time of writing gives a RMS errors of 22 m
Substantial difference in mountainous regions
There, are however, spots with significant difference. At 24 grid cells |DTOM DWGS84 | IS <0.5 M. The RMS of their difference is 4.6. There are 5 records with |DTOM DWGS84| >5 m. all the other records have |DTOM DWGS84|<2m.
The distance caused by the datum difference (D = the distance between C and D in Fig.2) and the slope of terrain woule be themost likey caused (refer to Fig. 2) of the large |DTOM DWGS84|. d is 0.72 cm where |DTOM DWGS84| is >0.5m for all the stereo match point. Correction between d and |DTOM DWGS84| where |DTOM DWGS84| is >0.5 m is 0.62.
Second, as to the impact of the slope parameter, Fig. 3 suggested that the large values of |DTOM DWGS84| are found prediomiantly over values are computed by applying the formulae of Zevenbergen and Thorene (1989) to the digitized map shown in Fig. 3 The slope of all the points in the test region is 10.7o RMS. The RMS slpe where |DTOM DWGS84| is <0.5 m is greater at 13.0o, supporting that the larger the slope is the greater |DTOM DWGS84| is. Correlation between the slope and |DTOM DWGS84| is 0.46.

Fig. 3 Locations of grid cells where SPOT DEM QA results on WGS84 datum and Tokyo Mean differ by > 5 cm. The contours are at an interval of 100 m starting at 0 m.
Conclusions
QA of a full -scale SPOT DEM is performed on WGS84 datum and on Tokyo Mean. QA results on two datum (DTOM and DWGS84) differ by merely 4.5 cm RMS (252,00 grid cells). There are, however, spots with significant difference. At 24 grid cells the difference is >0.5m. The RMS of their difference is 4.6 m. Correlation analysis that steeper terrain and greater horizontal distance between the two datum cause greater difference (|DTOM DWGS84|) between the two QA methods.
Acknowledgements
This work has been supported by the Korean Ministry of Science through a project "Development of high-resolution satellite data receiving and processing system".
Reference:
- Featherstone, W.E., and M.C. Dentith, 1998: A ravity approach to gravitydata reduction for geophysics. Comp. & Geoci, 23(10), 1063-1070.
- Kim, S.A.B. et al., 1999: Accuracy assessment of a DEM produced from SPOT stereo-images: resolving difference in geodetic datum, in preparation for submitting to Comp. & Geosci
- Lee, H.-Y., et al., 1999. Accurate DEM Extraction from SPOT Stereo pairs : A Stereo Matching Algorithm based on the Geometry of the Satellite. Proc. Asian Conf. Remote Sens. HongKong, PR China (accepted)
- Moore, I.D. et al., 1991: Digital Terrain Model : a review of hydrological, geomorphlogical and biological applications, Hydrological Processes, 5(1), 3-30.
- NIMA (National Imagery and Mapping Agency) 1999: www.nima.mil
- Sasowsky, K.C. et. al., 1992: Accuracy of SOT DEM and derivatives : Photogr.Eng. Remote Sens., 58(6), 815-824.
- Zevenbergen, L.W. and C.R. Thorne, 1987: Quantitative analysis of land surface topography, Earth Surf. Proc. Landforms, 12(1), 47-56.