| GISdevelopment.net ---> AARS ---> ACRS 1999 ---> Poster Session 3 |
Deciding the Flood Extent
with RADARSAT SAR Data and Image Fusion
Yang Cunjian Zhou Chenghu
Wan Qing
(LREIS, Chinese Academy of Sciences, Beijing 100101)
1.Introduction(LREIS, Chinese Academy of Sciences, Beijing 100101)
Flood is one of the most severe nature disaster. It is estimated that the loss owing to flood accounts for 30% of all the loss from the nature disasters[1]. In China, flood makes a loss so high as 15 to 20 billion yuan each year.
It is impractical to acquire the flood area through field investigating. The methods to extract flood extent from remotely sensed images such as TM, FY-IB and NOAA AVHRR are explored by a few persons[2][3][4]. Microwave remotes Sensing is very useful for monitoring flood because it can obtain useful image especially in bad weather. Flood extent can be automatically extracted from JERS SAR image in plain area[5], but it is difficult to automatically extract flood extent from SAR image in mountain area because of mislabeling shade of mountain as flood. Therefore, in mountain area, flood extent is mostly extracted from SAR images by visual interpretation. It is accurate but very labor intensive. The method proposed in this paper focuses on how to solve this problem with TM and SAR images.
2. Study area and principle
The study area of our research is the Qianshan country in Anhui province of china. The data sets used in this research includes: 91) LANDSAT TM 131/39 acquired on December 7,1995 (figure 1). (2)RADARSAT SWA SAR image acquired on July 28,1998 (Figure 2).
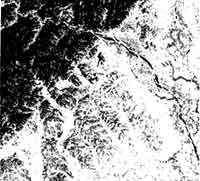
Figure 1 TM2 image of the study area
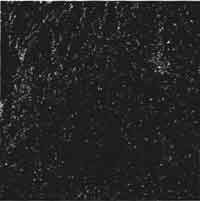
Figure 2 RADARSAT SWA SAR image of the study area
A single radar image is usually displayed as a gray scale image. The intensity of each pixel represents the proportion of microwave backscattered from that area on the ground, which depends on a variety of factors: types, sizes, shapes and orientations of the scatter in the target area: moisture content of the target area; frequency and polarization of the radar pulses; as well as the incident angles of the radar beam. The pixel intensity values are often converted to a physical quantity called the backscattering coefficient or normalized radar cross-section measured in decibel (dB) units with values ranging from +5 dB for very dark surfaces.
The SAR backscattered intensity generally increase with the roughness. Roughness’ is a relative quantity. For SAR images, the reference length scale for surface roughness is the wavelength of the mocrowave. It the surface fluctuation is less than the microwave wavelength, then the surface is considered smooth. For example, little radiation is backscattered from a surface with a functuation of the order of 5 cm if a fluctuation of the order of 5 cm if a L-band (15 to 30 cm wavelength) SAR is used and the surface will appear dark. However, the same surface will appear bright due to increased backscattering in a X-band (2.4 to 3.8cm wavelength) SAR image. Flat surface such as paved roads, runways or calm water normally appear as dark areas in a radar image since most of the incident radar pulses are reflected away. However, rough water surfaces may appear bright especially when the incidence angle is small. The urban area appears bright in the SAR image while the vegetated area has intermediate while the vegetated area has intermediate tone.
In mountain area, when slope is perpendicular to the radar look direction, the radar echoes will be accenturated and show bright in image. Otherwise, the radar echoes will be low and show dark tone such as shade in image, which is confused with the water body. It is the crux of deciding the water body. It is the crux of deciding the flood extent from the SAR image in mountain area.
Remotely sensed image fusion has been proved to be a good method in feature extraction. There are several methods of image fusion such as HIS conversion fusion and principle conversion fusion, which are based on pixel,, with aim at improving visual interpretation results or classification results. We utilize the object fusion technologies in the paper. The shades from LANDSAT TM can be used to eliminate the shades from RADARSAT SAR, if the shades from LANDSAT TM have the same extent with shades from RADARSAT SAR. The water bodies in LANDSAT TM can be used as base water body during disaster evaluation. During imaging, wind may make water surface very rough so that water bodies appear bright in the images, which is confused with land surface especially in the center of large lakes. The water body extent on TM images can be used to compensate the flood extent on SAR images especially for large lake with rough surface. Therefore, the flood extent can be extracted through the compensation of the shades and water body from LANDSAT TM and RADARSAT SAR.
3.Procedure and method
3.1Match of SAR with TM
Firstly, the control point such as the cross of roads, the cross of river, the turn of rivers, lakes or pools are equably selected respectively from LANDSAT TM and topographic maps. Twelve control points are selected. The coordinates are measured respectively from LANDSAT TIM and topographic maps. LANDSAT TM image is geometrically corrected through control points. The error is controlled within one pixel.
Secondly, the control points are equably selected respectively from TM and RADARSAT SAR. Also twelve control points are selected. And then RADARSAT SAR image is matched to LANDSAT TM. The error is controlled within one pixel.
3.2Extracting the primary flood extent from SAR image.
The value differing water in SAR image from land is determined through visual interpretation. And then the model as following is used to extract flood extent from SAR image.
{DN>=K is not flood extent
where, DN represents gray value in
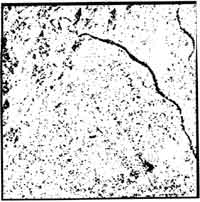
Figure 3 The primary flood extent from SAR
SAR image, K is threshold value. When K is equal to 35, The primary, flood extent can be extracted. (Figure 3), Some shade is mislabeled as flood extent.
3.3 Extracting shade from TM image
Shade in TM can be easily identified in TM2 or TM3, because shade has low value while other has high value. The model as follow can be used to extract shade from TM image.
{M2>=K is not shade
When K takes the value of 23, shade can be extracted from TM2 (figure 4).
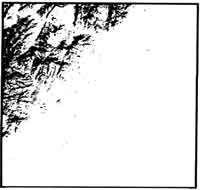
Figure 4. The shade from TM
3.4 Removing the flood mislabeled owing to shade from primary flood extent with shade from TM image.
Figure 5 is obtained by overlaying primary flood from SAR image and shade from TM image. Gray is shade from TM, dark is primary flood from SAR image. It can be seen that shade of mountain is mislabeled as flood. The mislabeled flood overlays largely with shade from TM image. Therefore, the command EXPEND in ARC/INFO GRID is applied to expand the shade from TM. Then the shade is used to overlay with RADARSAT SAR.
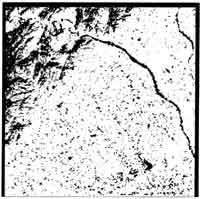
Figure 5. Overlay of the primary flood from SAR and shade on TM
Overlay analysis is used to process primary flood. All floods falling into the shade from TM is removed from the primary flood extent, which is regarded as mislabeled flood. The procedure is shown as figure 6.
The result is shown as figure 7. It can be seen that the mislabeled water owing to shade is largely reduced compared with figure 3. Indeed, a few water bodies connecting with shade may be incorrectly Removed because of expanding shade. We need to correct them.
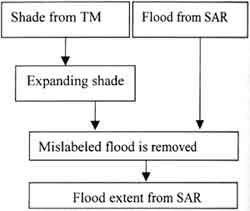
Figure 6 Removing mislabeled flood from the primary flood extent
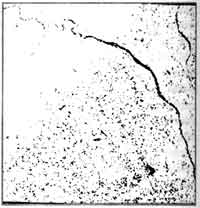
Figure 7 The flood extent from SAR without shade
3.5 Restoring flood incorrectly removed
Firstly, base water bodies are extracted from TM image by the model as follow :
{TM2>=K2
When K1 and K2 take the value 10 and respectively, base water bodies can
Secondly, command EXPAND of ARC/INFO can be used to expand base water bodies for two pixel. It is used to cut out the primary flood from SAR image. and then some of the omitted flood (figure 8) can be got, which is added to the flood extent without shade. The procedure is shown as following (figure 9):
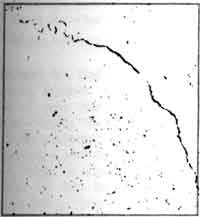
Figure 8 the water bodies including some of the omitted flood
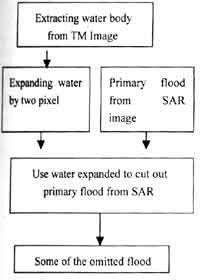
Figure 9 Restoring some of the omitted flood
3.6 Adding the omitted water bodies to the flood extent without shade
Because the resolution of RADARSAT SAR image is 50 meter, It is difficult to identify small water bodies. It can be solved with TM images. Moreover, in some case, water surface become rough owing to wind, which show higher gray level than the normal one, and make some water bodies omitted. In order to compensate the omission, the base water bodies from TM is added to the flood without shade, and the final flood extent is got (figure 10).
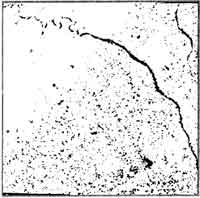
Figure 10 The final flood extent
4 Result and discussion
The result is analyzed through visual interpretation of flood in RADARSAT SAR image and water and topology in LANDSAT TM image. The accuracy is higher for plain place, and the mislabeling is very low. Omission is also lower. It is estimated that the accuracy can reach to 90% in plain area. In mountain area, the proposed method of automatically extracting water from RADARSAT SWA SAR is also proved to be effective by Visual interpreting shade and topography from TM and flood from RADARSAT SWA SAR. The accuracy can reach to 85%. More research need be done especially for other SAR imaging mode.
References
- Zhang jiqun. Remote sensing analysis of flood disaster neural network, PH.D. thesis of the university of Wuhan water and hydoelectrics 1995: page s2~3:84~99.
- Dai Changda, Tang Linili, Chen Gang, The theory and practice of applying Landsat TM image to monitor and evaluate forest fire, pest insect and flood, Remote Sensing of Environment, 1993, 8(2): 102-110.
- Sheng Yong Wei, Xiao Qianguang and Chen Weiying, Study of applying FY-1B meteorological satellite to monitor the flood of 1971. Remote Sensing of Environement 1994, 9(3): 228-233.
- Zhou Chenghu, Du Yunyan, Method and model for automatically extracting flood extent from NOAA AVHRR image on basis of knowledge. Journal of natural disaster, 1997, 6(4):100~108.
- YangCunjian WeiYiming Chen Dequing Investigation on extracting the flood inundated area from JERS-1, flood inundated area from JERS-1, Journal of natural disaster, 1998, 7(3):43~50.
- Guo Huadong, Xu Guanhu, Study on application of satellite radar, China science and technology press, 1996,3:203-208.
- Jian Yonghong, Li Diren. The comparison of application four HIS conversion in fusion of SAR and TM image, Journal of remote sensing, 1998, 2(3) :103 _106.
- Fang Hongliang, Yang Xiaomei, Du Yungan, Application of principle
conversion and inconversion in fusion of ADEOS AVNIR SX and PAN, Remote
sensing technology and application, 1998
13(3).