| GISdevelopment.net ---> AARS ---> ACRS 1999 ---> Poster Session 3 |
Detection of Oil Spills in
Malaysian Waters from Radarsat Synthetic Aperture Radar Data and
Prediction of Oil Spill Movement
Mohd Ibrahim Seeni Mohd. Anura Mohd Salleh & Loh Chen Tze
Department of Remote Sensing, Faculty of Geoinformation Science and Engineering
Universiti Teknologi Malaysia, 81300 skudai, Johor, Malaysia
Tel: (607) 5502880 Fax: (607) 5566163
E-Mail:mism@fksg.utm.my
Mohd Ibrahim Seeni Mohd. Anura Mohd Salleh & Loh Chen Tze
Department of Remote Sensing, Faculty of Geoinformation Science and Engineering
Universiti Teknologi Malaysia, 81300 skudai, Johor, Malaysia
Tel: (607) 5502880 Fax: (607) 5566163
E-Mail:mism@fksg.utm.my
Oil spills at sea pollute the marine environment to a
varying degree during large oil tanker accidents, especially when they
occur close to the coast. On the other hand, oil release from ships, when
cleaning tanks, may prove to be a much worse pollution. When taking into
account how often such spills occur during regular ship operation. The
effects of the pollution can be minimized if the spills can be detected
early. Spaceborne radar remote sensing may be employed to help detect oil
spills. It has been documented that SAR has certain capabilities to detect
oil spills because of large-area coverage and all weather observation. By
combining filtering techniques (Katrine et al., 1993) and fuzzy
classification (Barni et al., 1995) the oil spill/slick areas can be
enhanced to improve their detection.
However, limitations exist and it is necessary to have better knowledge of these limitatios before SAR data can be utilized in an oil spill monitoring system. The problem in detecting oil spills/slicks on the ocean surface using satellite SAR images, lies in distinguishing oil from other phenomena that dampen out the short waves and create dark patches. Oil spills/slicks look-alike may include natural film, threshold wind speed areas, wind sheltering by land, rain cells, current shear zones, internal waves and upwelling (Heidi et al., 1994).
The ability to predict oil spills/slicks movement will assist in the assessment of damage. Prediction is hampered by the present lack of capability to quantify the combined effects of winds, waves and currents on the movement of oil spills/slicks near the coast (Beer et al., 1983). Computer modeling is the best way to predict the oil spill/slick movement. Research on oil spill modeling has been extremely active over the past decade. Models for predicting the transport of oil spills/slicks were done by Cuesta et al. (1990) using the continuity and momentum conservation equation and by Shankar et al. (1996) using the 2-D depth averaged transport-dispersion equation.
It is important that predictive analyses based on mathematical models are made to evaluate the fate of possible oil spills for adequate risk assessments. This can be done on a real time basis to assist the containment, control and recovery of the oil. Models are used for estimating the environmental impact due to an actual spill or potential spills and used to find probabilities of oil contaminating certain areas. In this study, Radarsat SAR data has been processed using filtering and fuzzy classification techniques to improve the detection of oil spill and a computer program has been written to predict the movement of an oil spill off the coast of Batu Pahat, Johor.
Study Area and Satellite Data Used
The study area is located near Batu Pahat in the Straits of Malacca between Sumatera and west coast of Johor as shown in Figure 1(a). The satellite data used in the study is the Radarsat SAR data 9Figure 1(b)) acquired on 26 October 1997 which shows on oil spill from a collision between two ships, i.e. MT Orpin Global and MV Evoikos in Singapora. The collision occurred on 15 October 1997 and caused 25000 tones of crude oil to be spilled into the sea.
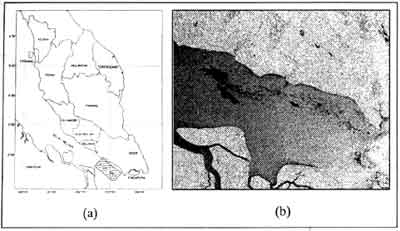
Figure 1 : (a) Study area (b) Radarsat image of the study area
Dection of Oil Spills/Slicks
The satellite data was geometrically corrected and the detection of oil spills/slicks was enhanced by carrying out image processing that includes filtering and fuzzy classification.
Filtering
Speckle or noise that are contained within a SAR image is the main cause of difficulty in interpreting the data. Such variation made it difficult to distinguish between areas of subtly different backscatter properties, as a consequence limiting the radiometric resolution obtainable. The effect is most noticeable for homogeneous targets, and resolution obtainable. The effect is most noticeable for homogeneous targets, and hinders the ability to distinguish point targets have been used to enhance oil spill/slick areas. The window size range from 3x3 to 11x11. although the window size can be increased to 33x33 the results are not satisfactory because of information loss.
Qualitative and quantitative evaluation were carried out on the filters. The qualitative evaluation is based on the preservation and enhancement of edges, texture and retention of original image. For this purpose, visual interpretation was made on every window size of each filter. The quantitative evaluation of the filters is primarily based on variation coefficient values which are obtained by dividing the mean digital number by the standard deviation. Preservation of the mean value of the original image is expected after filtering with minimum value of standard deviation.
The filters used in this study are Lee, Forest, enhanced Frost, Kuan, Gamman and Gaussian Sigma. Figure 2 shows the geometrically corrected image and subscene image used for filtering. The filters used and the related statistical information are given in Tabl 1. The Kuan filter has been found to be the most suitable filter for enhancing oil spill/slick areas.
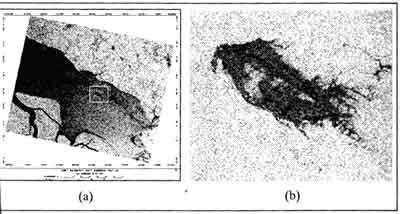
Figure 2: (a) Geometrically corrected image (b) Subscene image showing oil spill
Table 1:Filters used with statistical information
Fuzzy Classification
As mentioned earlier speckle or noise is the main problem in SAR image interpretation, even a zone that is homogeneous on the ground has a ground has a granular aspect and a statistical distribution with a large standard deviation. Therefore, the first step in the fuzzy classification technique is filtering operation. The filter used for this operation is Kuan filter. Classification was made based on algorithm developed by Bezdek and Trivedi (1986) which is a fuzzy extension of the least square criterion.
Jm(U, V)=nSk=1 cS(Uik)m||Xk - Vi|| (1)
where X = {x1,x2,….., xn} is the data set
V = {v1,v2,…….vc} is the set of protype
uik = membership value of point xk in cluster Vi
m = the fuzziness of cluster controller
In remote sensing images, a pixel corresponds on the ground to a cell of tens of square meters which quite often contain mixture of surface-cover classes; in addition, boundaries among regions are hardly ever sharp. Fuzzy set theory provides useful concepts and tools to cope with this sort of problem. Here, a membership function is assigned to each pixel belonging to the set. The memberships can be classified as full membership, no membership or partial membership (Barni et al., 1995).
Once the fuzzy classification is obtained, a clustering map is produced by assigning each pixel to the cluster which it mostly belongs. A final operation involves post-filtering of the map to obtain more homogeneous regions. Figure 3 shows the result of fuzzy classification of the oil spill carried out on the Radarsat image.
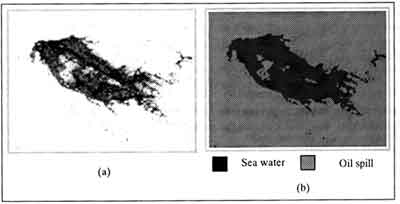
Figure 3: (a) Kuan filtered image (b) Result from fuzzy classification
Oil Movement Modelling
Many authorities have prepared oil spill contingency plans, an important element in these plans is the use of computer models to predict the movement of spilled oil and its possible impact. Modelling of oil spills requires combining several components some of which are interrelated. The two main components are : hydrodynamics; and the physico-chemical aspects of the oil In this study, some of the physico-chemical processes are not included. It is not practical to include all the processes in a model at all times, one must use his own judgment to include only the most significant process necessary to to achieve the objectives. This section of the paper describes the application of an oil spill modeling system for predicting the transport and fate of spilled oil. The model developed is a 2-D finite difference numerical model based on transport-dispersion equation (Shankar et al., 1996).
To model an oil spill accurately, it is essential to have reliable information on the current magnitudes and directions. While this is best achieved by actually collecting the hydraulic data using field measurements, such a procedure may not always be practical, especially when predictive analyses are required. In this study, the hydrodynamic inputs to the oil movement model are generated from complementary 2-D hydrodynamic model (Ahmad Khairi, 1989) which is formulated based on the shallow water wave equation of motion and the equation of mass continuity. The flow equations are solved numerically by finite difference implicit method. The hydrodynamic information pertaining to the model area is required for modeling of oil spils.
Governing Equations
The simulation of the movement of spilled oil requires a mathematical description of the physical process of depressive transport. In this study, a 2-D depth averaged transport-dispersion equation is adopted to simulate the transport of oil on the water surface. The dominant movement of the oil is assumed to be convective-depressive transport. The 2-D depth average mass balance equation for a continuous point source is given by,
Jc/Jd = -u(Jc/Jx) - n(Jc/Jy) + Kx(J2c/Jx2) + Ky(J2c/Jy2) + S (2)
where t is the time, c is the depth averaged oil concentration; u,v are depth averaged velocities in the x any y directions; time, c is the depth averaged oil concentration; u, v are depth averaged velocities in the x any y directions; Kx, Ky are the dispersion coefficients in the x and y directions; S is the mass rate of oil spill.
Finite Difference Method
The governing equation (2) has been solved in a two-dimensional domain corresponding to the marine environment where the oil is spilled. In terms of generalized coordinates, equation (2) may be written as
[p + 4K]n+1Ci, j - K[n+1Ci+1,J + n+1Ci-1, ,j + n+1Ci, j+1 + n+1Ci,j-1]
=Dh[unci+1,j + nnCi,j+1] + [p + uDh + nDh]nCi,j + Dh2 (3)
where p = Dh/Dt
Dh = grid size of in x and y direction
Dt = time interval
K = dispersion coefficients in x and y directions.
Equation (3) has been discretized by means of means of a finite difference scheme. In this method, oil is represented as an ensemble of a large number of small parcels. These parcels can be on the water surface or in suspension. Each parcel has a mass and a set of time dependent spatial coordinates associated with it. These parcels are first introduced into the water at the spill site at a rate corresponding to the spilling rate. The advection of each parcel is affected by the wind, water current and concentration of surrounding parcels. During each time step, all of the oil parcels are displaced according to the drift velocity and a fluctuation component at their respective locations. This method is inherently stable, however, the time step should be deermined be determined based on the grid size and local flow velocity of guarantee accuracy (Yapa, 1994).
During each time step oil parcel locations are first computed in grid system fixed in space, based on advection and turbulent diffusion. Since the movement of each parcel is dependent upon the distribution of the entire ensemble on the water surface and in the suspension, all parcels must be traced to one time level before proceeding to the next.
Results
Figure 3(a) shows the best result from the filtering technique using Kuan filter with 11x11 window size. It has been found that other filters such as Frost and Gaussian Sigma can also be used to enhance oil spill/slick areas. Figure 3(b) shows the result from the fuzzy classification which clearly outlines the oil spill/slick areas. The accuracy for this classification is 83.3% when compared to the manual segmented image.
The movement of oil has been simulated every six hours interval as shown in Figure 4. In the simulation, the computational domain has been defined by a 75 by 25 grid size, corresponding to an area of 150 km of coastline and 50 km perpendicular to the coastline. The calculations have been carried out assuming that the spill at Batu Pahat contains 1000 tons of oil on 26 October 1997 (acquisition date of Radarst data). The predicted direction of spill from Radarsat data.
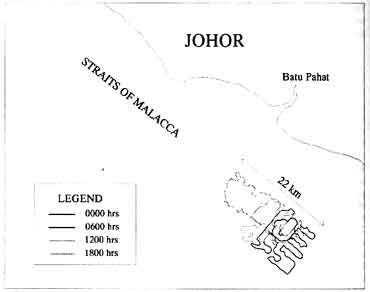
Figure 4: Simulated oil spill movement near Batu pahat in the Straits of Malacca.
Discussions and Conclusions
The study shows that by using filtering and fuzzy classification on the Radarsat SAR dta oil spills/slicks can be detected and delineated clearly. The suitable filers for enhancing oil spill/slick areas are Kuan, Frost and Gaussian Sigma using window size 9x9 or 11x11. fuzzy classification also improves the delineation of oil spill/slick areas. Satelliteremote sensing using SAR can assist in detecting and mapping the extent of oil spills/slicks. However, one should be careful so as not to misinterpret oil spill/slick look-alike such as natural film, rain cell etc. since they look quite similar.
The simulation of the accidental oil spill near Batu pahat shows that the model can predict the oil spill/slick trajectories. Further research is needed to incorporate the effects of changing physical properties, weather process such as evaporation and dissolution, emulsification and bio-degradation. The essential parameter in the determination of oil movement is the wind-induced sea currents. Thus, the definition of a wind field, as well as the use of reliable data on sea currents and tides,a re crucial to predict accurately oil spill trajectioies (Cuesta et al., 1990). The computer model developed in this study may assist in the estimation of environmental impact of an accidental oil spill and to design efficient emergency strategies.
References
However, limitations exist and it is necessary to have better knowledge of these limitatios before SAR data can be utilized in an oil spill monitoring system. The problem in detecting oil spills/slicks on the ocean surface using satellite SAR images, lies in distinguishing oil from other phenomena that dampen out the short waves and create dark patches. Oil spills/slicks look-alike may include natural film, threshold wind speed areas, wind sheltering by land, rain cells, current shear zones, internal waves and upwelling (Heidi et al., 1994).
The ability to predict oil spills/slicks movement will assist in the assessment of damage. Prediction is hampered by the present lack of capability to quantify the combined effects of winds, waves and currents on the movement of oil spills/slicks near the coast (Beer et al., 1983). Computer modeling is the best way to predict the oil spill/slick movement. Research on oil spill modeling has been extremely active over the past decade. Models for predicting the transport of oil spills/slicks were done by Cuesta et al. (1990) using the continuity and momentum conservation equation and by Shankar et al. (1996) using the 2-D depth averaged transport-dispersion equation.
It is important that predictive analyses based on mathematical models are made to evaluate the fate of possible oil spills for adequate risk assessments. This can be done on a real time basis to assist the containment, control and recovery of the oil. Models are used for estimating the environmental impact due to an actual spill or potential spills and used to find probabilities of oil contaminating certain areas. In this study, Radarsat SAR data has been processed using filtering and fuzzy classification techniques to improve the detection of oil spill and a computer program has been written to predict the movement of an oil spill off the coast of Batu Pahat, Johor.
Study Area and Satellite Data Used
The study area is located near Batu Pahat in the Straits of Malacca between Sumatera and west coast of Johor as shown in Figure 1(a). The satellite data used in the study is the Radarsat SAR data 9Figure 1(b)) acquired on 26 October 1997 which shows on oil spill from a collision between two ships, i.e. MT Orpin Global and MV Evoikos in Singapora. The collision occurred on 15 October 1997 and caused 25000 tones of crude oil to be spilled into the sea.
Figure 1 : (a) Study area (b) Radarsat image of the study area
Dection of Oil Spills/Slicks
The satellite data was geometrically corrected and the detection of oil spills/slicks was enhanced by carrying out image processing that includes filtering and fuzzy classification.
Filtering
Speckle or noise that are contained within a SAR image is the main cause of difficulty in interpreting the data. Such variation made it difficult to distinguish between areas of subtly different backscatter properties, as a consequence limiting the radiometric resolution obtainable. The effect is most noticeable for homogeneous targets, and resolution obtainable. The effect is most noticeable for homogeneous targets, and hinders the ability to distinguish point targets have been used to enhance oil spill/slick areas. The window size range from 3x3 to 11x11. although the window size can be increased to 33x33 the results are not satisfactory because of information loss.
Qualitative and quantitative evaluation were carried out on the filters. The qualitative evaluation is based on the preservation and enhancement of edges, texture and retention of original image. For this purpose, visual interpretation was made on every window size of each filter. The quantitative evaluation of the filters is primarily based on variation coefficient values which are obtained by dividing the mean digital number by the standard deviation. Preservation of the mean value of the original image is expected after filtering with minimum value of standard deviation.
The filters used in this study are Lee, Forest, enhanced Frost, Kuan, Gamman and Gaussian Sigma. Figure 2 shows the geometrically corrected image and subscene image used for filtering. The filters used and the related statistical information are given in Tabl 1. The Kuan filter has been found to be the most suitable filter for enhancing oil spill/slick areas.
Figure 2: (a) Geometrically corrected image (b) Subscene image showing oil spill
Table 1:Filters used with statistical information
| Type of Filter | Window Size | Mean DN | Std.Dev. | Variation Coeff. |
| Raw Image | 292.68 | 68.42 | 4.28 | |
| Lee | 3x3 5x5 7x7 9x9 11x11 |
292.77 293.75 295.41 297.50 299.75 |
50.25 38.83 32.74 29.50 27.81 |
5.83 7.56 9.02 10.09 10.78 |
| Enhanced Lee | 3x3 5x5 7x7 9x9 11x11 |
296.16 298.70 301.02 303.09 305.02 |
50.55 39.76 33.89 30.67 29.43 |
5.86 7.5 8.88 9.88 10.36 |
| Frost | 3x3 5x5 7x7 9x9 11x11 |
50.34 39.01 32.94 29.50 27.58 |
50.34 39.01 32.94 29.50 27.58 |
5.81 7.53 8.96 10.07 10.85 |
| Enhanced Frost | 3x3 5x5 7x7 9x9 11x11 |
50.36 39.55 33.79 30.62 29.35 |
50.36 39.55 33.79 30.62 29.35 |
5.89 7.56 8.92 9.90 10.38 |
| Kuan | 3x3 5x5 7x7 9x9 11x11 |
50.25 38.84 32.76 29.52 27.88 |
50.25 38.84 32.76 29.52 27.88 |
5.83 7.56 9.02 10.08 10.75 |
| Gamma | 3x3 5x5 7x7 9x9 11x11 |
51.10 40.75 35.09 32.28 31.49 |
51.10 40.76 35.09 32.28 31.49 |
5.78 7.30 8.53 9.32 9.60 |
| Gaussina Sigama | 3x3 5x5 7x7 9x9 11x11 |
37.52 31.90 29.47 28.22 27.64 |
37.52 31.90 29.47 28.22 27.64 |
7.84 9.28 10.10 10.60 10.87 |
Fuzzy Classification
As mentioned earlier speckle or noise is the main problem in SAR image interpretation, even a zone that is homogeneous on the ground has a ground has a granular aspect and a statistical distribution with a large standard deviation. Therefore, the first step in the fuzzy classification technique is filtering operation. The filter used for this operation is Kuan filter. Classification was made based on algorithm developed by Bezdek and Trivedi (1986) which is a fuzzy extension of the least square criterion.
Jm(U, V)=nSk=1 cS(Uik)m||Xk - Vi|| (1)
where X = {x1,x2,….., xn} is the data set
V = {v1,v2,…….vc} is the set of protype
uik = membership value of point xk in cluster Vi
m = the fuzziness of cluster controller
In remote sensing images, a pixel corresponds on the ground to a cell of tens of square meters which quite often contain mixture of surface-cover classes; in addition, boundaries among regions are hardly ever sharp. Fuzzy set theory provides useful concepts and tools to cope with this sort of problem. Here, a membership function is assigned to each pixel belonging to the set. The memberships can be classified as full membership, no membership or partial membership (Barni et al., 1995).
Once the fuzzy classification is obtained, a clustering map is produced by assigning each pixel to the cluster which it mostly belongs. A final operation involves post-filtering of the map to obtain more homogeneous regions. Figure 3 shows the result of fuzzy classification of the oil spill carried out on the Radarsat image.
Figure 3: (a) Kuan filtered image (b) Result from fuzzy classification
Oil Movement Modelling
Many authorities have prepared oil spill contingency plans, an important element in these plans is the use of computer models to predict the movement of spilled oil and its possible impact. Modelling of oil spills requires combining several components some of which are interrelated. The two main components are : hydrodynamics; and the physico-chemical aspects of the oil In this study, some of the physico-chemical processes are not included. It is not practical to include all the processes in a model at all times, one must use his own judgment to include only the most significant process necessary to to achieve the objectives. This section of the paper describes the application of an oil spill modeling system for predicting the transport and fate of spilled oil. The model developed is a 2-D finite difference numerical model based on transport-dispersion equation (Shankar et al., 1996).
To model an oil spill accurately, it is essential to have reliable information on the current magnitudes and directions. While this is best achieved by actually collecting the hydraulic data using field measurements, such a procedure may not always be practical, especially when predictive analyses are required. In this study, the hydrodynamic inputs to the oil movement model are generated from complementary 2-D hydrodynamic model (Ahmad Khairi, 1989) which is formulated based on the shallow water wave equation of motion and the equation of mass continuity. The flow equations are solved numerically by finite difference implicit method. The hydrodynamic information pertaining to the model area is required for modeling of oil spils.
Governing Equations
The simulation of the movement of spilled oil requires a mathematical description of the physical process of depressive transport. In this study, a 2-D depth averaged transport-dispersion equation is adopted to simulate the transport of oil on the water surface. The dominant movement of the oil is assumed to be convective-depressive transport. The 2-D depth average mass balance equation for a continuous point source is given by,
Jc/Jd = -u(Jc/Jx) - n(Jc/Jy) + Kx(J2c/Jx2) + Ky(J2c/Jy2) + S (2)
where t is the time, c is the depth averaged oil concentration; u,v are depth averaged velocities in the x any y directions; time, c is the depth averaged oil concentration; u, v are depth averaged velocities in the x any y directions; Kx, Ky are the dispersion coefficients in the x and y directions; S is the mass rate of oil spill.
Finite Difference Method
The governing equation (2) has been solved in a two-dimensional domain corresponding to the marine environment where the oil is spilled. In terms of generalized coordinates, equation (2) may be written as
[p + 4K]n+1Ci, j - K[n+1Ci+1,J + n+1Ci-1, ,j + n+1Ci, j+1 + n+1Ci,j-1]
=Dh[unci+1,j + nnCi,j+1] + [p + uDh + nDh]nCi,j + Dh2 (3)
where p = Dh/Dt
Dh = grid size of in x and y direction
Dt = time interval
K = dispersion coefficients in x and y directions.
Equation (3) has been discretized by means of means of a finite difference scheme. In this method, oil is represented as an ensemble of a large number of small parcels. These parcels can be on the water surface or in suspension. Each parcel has a mass and a set of time dependent spatial coordinates associated with it. These parcels are first introduced into the water at the spill site at a rate corresponding to the spilling rate. The advection of each parcel is affected by the wind, water current and concentration of surrounding parcels. During each time step, all of the oil parcels are displaced according to the drift velocity and a fluctuation component at their respective locations. This method is inherently stable, however, the time step should be deermined be determined based on the grid size and local flow velocity of guarantee accuracy (Yapa, 1994).
During each time step oil parcel locations are first computed in grid system fixed in space, based on advection and turbulent diffusion. Since the movement of each parcel is dependent upon the distribution of the entire ensemble on the water surface and in the suspension, all parcels must be traced to one time level before proceeding to the next.
Results
Figure 3(a) shows the best result from the filtering technique using Kuan filter with 11x11 window size. It has been found that other filters such as Frost and Gaussian Sigma can also be used to enhance oil spill/slick areas. Figure 3(b) shows the result from the fuzzy classification which clearly outlines the oil spill/slick areas. The accuracy for this classification is 83.3% when compared to the manual segmented image.
The movement of oil has been simulated every six hours interval as shown in Figure 4. In the simulation, the computational domain has been defined by a 75 by 25 grid size, corresponding to an area of 150 km of coastline and 50 km perpendicular to the coastline. The calculations have been carried out assuming that the spill at Batu Pahat contains 1000 tons of oil on 26 October 1997 (acquisition date of Radarst data). The predicted direction of spill from Radarsat data.
Figure 4: Simulated oil spill movement near Batu pahat in the Straits of Malacca.
Discussions and Conclusions
The study shows that by using filtering and fuzzy classification on the Radarsat SAR dta oil spills/slicks can be detected and delineated clearly. The suitable filers for enhancing oil spill/slick areas are Kuan, Frost and Gaussian Sigma using window size 9x9 or 11x11. fuzzy classification also improves the delineation of oil spill/slick areas. Satelliteremote sensing using SAR can assist in detecting and mapping the extent of oil spills/slicks. However, one should be careful so as not to misinterpret oil spill/slick look-alike such as natural film, rain cell etc. since they look quite similar.
The simulation of the accidental oil spill near Batu pahat shows that the model can predict the oil spill/slick trajectories. Further research is needed to incorporate the effects of changing physical properties, weather process such as evaporation and dissolution, emulsification and bio-degradation. The essential parameter in the determination of oil movement is the wind-induced sea currents. Thus, the definition of a wind field, as well as the use of reliable data on sea currents and tides,a re crucial to predict accurately oil spill trajectioies (Cuesta et al., 1990). The computer model developed in this study may assist in the estimation of environmental impact of an accidental oil spill and to design efficient emergency strategies.
References
- Ahmed Khairi, 1989. river mouth siltation at sungai Pengkalan Datu,
Kelantan. MSc Thesis, Universiti Teknologi Malaysia.
- Barni, M., Betti, M. & Mecoeei, A. (1995). "A fuzzy approach to
oil spill detection on SAR images". International Electronic and
Electrical Engineering. 71(1), 157-159.
- Beer, T., Humphries, R.B. & Bouwhuis, R. (1983). " Modelling
nearshore oil slick trajectories". Marine Pollution Bulletin. Vol. 14,
No. 4; pp. 141-144.
- Bezdek, JC. & Trivedi, M.M. (1986). "Low-level segmentation of
aerial images with fuzzy clustering". International Electronic and
Electrical Engineering of Transactions on systems, Cybernetics. 16(4),
589-598.
- Cuesta, I., Grau, F.x. & Giralt. F. (1990). "Numerical
simulation of oil spills in a generalized domain". Oil & Chemical
Pollution. Vol. 7' pp. 143-159.
- Heidi, H.A., Johannessen, J.A. & Digranes, G. (1994). "Slick
detection in SAR images". International Electronic and Electrical
Engineering. 70(11), 2038-2040.
- Katrine, W.B., Anne, H.S.S. & rune, S. (1993). "Oil spill
detection in SAR imagery". International Geoscience & Remote Sensing
syiposium. Pp. 943-945.
- Shankar, N.J., Ng, W.J., Yang, H & Toh, A.C. (1996). "Numerical
simulation of an Asociation for Hydraulic Research. Technical session
3,4,5. Langkawi, Malaysia for Hydraulic Research Technical session
3,4,5. Langkawi, Malaysia. pp. 1-10.
- Yapa, P.D. 1994. "Oil spill processes and model development" Journal of Advanced marine Technology Conference AMTEC. (11)1-22.