|
http://www.gisdevelopment.net/aars/acrs/1999/ps3/ps3053pf.htm |
Correlation Analysis between Carbon Dioxide
Concentration and Vegetation Distribution
Mitsugu
Sonu1, Yasumi Fujinuma2, Masayuki
Tamura2, Yosifumi Yasuoka1
1:Institute
of Industrial Science, University of Tokyo
4-6-1 Komaba, Meguro-ku,
Tokyo 153-0085 Japna
Tel: 81-3-5452-6417 Fax 81-3-5452-6417
Email:
sone@skl.iis.u-tokyo.ac.jp
2:
National Institute for Envionmental Studies
16-2 Onogawa, Tsukuba,
Ibaraki, Japan
Keywords:
NDVI, CO2 concentration, Correlation analysis, Back trajectory
of air mass
Abstract
Variations in amplitude and time of
a seasonal cycle of carbon dioxide (CO2) concentration show a
relation with a seasonal change in distribution to photosynthetic
activities of vegetation. However, the quantitative relation between them
has not been clarified yet. In this study time series CO2
concentration data observed at Hateruma, monitoring station, Okinawa.
Japan is analyzed together with the series NDVI data derived from
NOAA/AVHRR around East Asia to investigate the quantitative relation
between their seasonal variations. The results show that the
CO2 conectionation at hateruma has correlation with the NDVI
values averaged around hateruma and also with the NDVI values averaged
along the back trajectories of air masses to hateruma.
1.Introdution
It is well known that the seasonal cycle
of carbon dioxide (CO2) concentration has a seasonal change in
vegetation distribution due to photosynthetic activities of vegetation. In
northern hemisphere, for example, CO2 concentration is lower in
summer since vegetation activities are high in summer. This relation is
confirmed in global scale, however, in regional or local scale the
relation between CO2 concentration and vegetation activities
are not quantitatively verified yet.
In this study, time series
CO2 concentration data observed at hateruma monitoring station,
Japan (Longitude 123.8, Latitude : 24.0) is analyzed together with the
time series NDVI dta derived from NOAA/AVHRR around the station in order
to investigate the quantitative relation between them. The NDVI
(Normalized Difference Vegetation Index) derived from satellite is well
known to have a correlation with the fraction of photosynthetically active
radiation absorbed by vegetation, and as a result, with photosynthetic
activities of vegetation. Statistical correlation analysis was performed
for monthly CO2 data averaged from daily Data and monthly NDVI
data averaged over the selected areas. Two cases are tried for NDVI
averaging. First, NDVI values are averaged uniformly around the monitoring
station, and next NDVI are selectively averaged along the back
trajectories of air mass to the station corresponding to the wind vector
(Fig. 1)
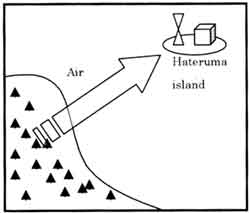
Fig.1
Back trajectory analysis
2.
Data used in the study
2.1. Green House Gase
data
Time series GHG concentrations including CO2 ,
CH4, O2 etc have been observed at hateruma island,
Okinawa and at Ochiishi, Hokkaido in Japan as base line data for GHG by
National Institute for Environmental Studies (NIES). In this study
CO2 data at hateruma station was used for the correlation
analysis with NDVI distribution. Gas monitoring is carried out hourly
basis, however, in this study original data was averaged in each month to
get monthly data to compare with monthly composite NDVI data. Figure 2
shows an example of time series CO2 concentration at hateruma
station in 1997 which shows typical characteristics of seasonal change.
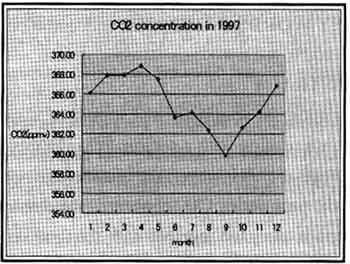
Fig
2. CO2 concentration change in 1997
2.2
NDVI data
Time series NDVI images of 1996 and 1997 was obtained
from the NOAA/AVHRR data received at two stations operated by the NIES
(Kuroshima, Okinawa and Tsukuba. Ibaraki
in Japan). They
can cover most of East Asian region. In this study monthly composite NDVI
data was used for correlation analysis with CO2 data. Spatial
resolution of NDVI data is around 1.1 km and each pixel has a NDVI value
scaled from 0 to 255.
2.3 Back trajectory
In order to
precisely analyze time series CO2 concentration is required to
know the flow of air mass that carried CO2 gas to the
monitoring station. In this study, the back trajectory of air mass at the
height of 1500 m for everyday was calculated based on the meteorological
data provided by the ECMWF and the model developed by the NIES. The back
trajectory data set includes a set of latitudes and longitudes of the air
mass at 73 points from hateruma to the source point three days before the
monitoring day. Figure 3 shows an example of back trajectory. Back
trajectory data was used to calculate the NDVI distribution along the path
of the air mass to hateruma.
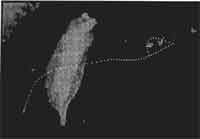
Fig.
3 An Example of back trajectory
3.Correlation
analysis between NDVI and CO2 concentration
Relation
between CO2 concentration at the hateruma station and
vegetation cover conditions around the station was investigated by
correlation analysis between them. As for the vegetation cover condition,
the distribution of NDVI was used. First, NDVI values are averaged in a
circular region around the monitoring station, and next, NDVI values are
selectively averaged along the back trajectories of air mass to the
station.
3.1Average NDVI in a circular region
The average
monthly NDVI value around the hateruma station was calculated for the
circular areas with different radii of 100km, Correlation between the
average monthly NDVI value and CO2 concentration of
corresponding month was calculated for each circle to evaluate the global
relation between them. Figure 4 illustrates an example of the circular
area with a radius of 500km, and Fig. 5 shows the correlation for it
(R2=0.585). Also Table 1 summarizes the coefficient of correlation between
CO2 concentration and the average NDVI for each
circle.
From these results it is shown that the CO2 has
negative correlation between the NDVI values, and that the CO2
concentration is low for the highly vegetation areas. Also Table 1 shows
that the correlation coefficients are quite low for the cases where the
percentage of land cover areas in each circle is low. It implies that the
CO2 concentration has relation primarily with vegetation cover
conditions over land. In this analysis, however, it shows that the
correlation is not stable. It might be party because the flow of
CO2 gas to the station is not considered. Then the correlation
between the CO2 concentration and the average NDVI was analyzed
with back trigectory of air mass.
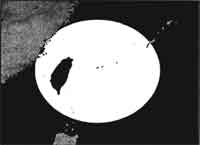
Fig.4
The average area of NDVI value
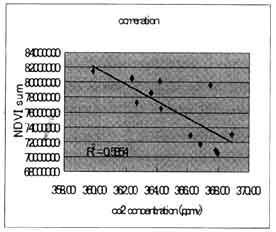
Fig.
5 the subtractive correlation
Table
1 the coefficient of correlation (R2) between CO2
and NDVI in 1996 and 1997 for each radius circle
|
Radius |
100 |
500 |
1500 |
2000 |
|
Coefficient
ofCorrelation (In 1996) |
0.163 |
0.311 |
0.361 |
0.263 |
0.252 |
|
Coefficient
ofCorrelation (In 1997) |
0.441 |
0.420 |
0.585 |
0.518 |
0.464 |
|
The
percentage of land area (in 96 and 97) |
1.70% |
5.50% |
19.55% |
25.95% |
30.70% |
3.2
Average NDVI along back trajectory
The NDVI values along the back
trajectory of air mass was averaged for the area of the 100km width from
the trajectory. Figure 6 shows an example of the averaging area (the area
painted black is the land area within the area along the back trajectory)
And Figure 7 shows the monthly variation of NDVI averaged along the back
trajectory in 1996 and 1997 which shows the typical variation pattern of
vegetation activities. The NDVI variations in Fig. 7 show some negative
correlation with CO2 variations compared with Fig.2.

Fig.6
An Averaging area of NDVI values along the back
trajectory
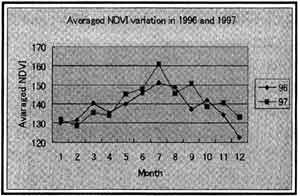
Fig.
7. NDVI variation along back trajectory
4.Conclusions
The
relation between the CO2 concentration and the vegetation cover
conditions (NDVI) was investigated. As expected, the results imply that
the air mass coming from the ocean has the back ground CO2
concentration representing global concentration, whereas the air mass
coming from land areas has correlation with the local NDIV values. For
more quantitative analysis it is required to construct the model
describing the movement of air mass and CO2 absorption by
vegetation.
Authors would like to express our thanks for the NIES
for providing us the GHG data and NDVI data. We also thank Dr. Katsumoto
and Dr. hashimoto of the NIES for their kind help for analyzing the GHG
data and back trajectory data.
References:
- R.B.Myneni,
et.al (1997) : Increased plant growth in the northern high latitudes
from 1981 to 1991, Nature, vol. 386, pp.698-702
|