| GISdevelopment.net ---> AARS ---> ACRS 1999 ---> Poster Session 2 |
Estimation of Rice-Planted
Areas in Early stage using RADARSAT Data
Shoji Takeuchi, Tomohisa
Konishi, Yoshinari Oguro and Yuzo Suza
Hiroshima Institute of Technology,
2-1-1, Miyake, Saki-ku, Hiroshima, 731-5193 JAPAN
Tel: (81)-82-921-2131 ext (948) Fax: (81)-82-922-5204
E-mail: sh-take@cc.it-hiroshima.ac.jp
Keywords: RADARSAT, Rice Area Estimation,
Backscatter Change of RiceHiroshima Institute of Technology,
2-1-1, Miyake, Saki-ku, Hiroshima, 731-5193 JAPAN
Tel: (81)-82-921-2131 ext (948) Fax: (81)-82-922-5204
E-mail: sh-take@cc.it-hiroshima.ac.jp
Abstract:
The authors attempted to estimate rice-planted areas using RADARSAT mode data in an early stage after rice planting. The eastern part of Hiroshima City, Higashi-Hiroshima City, was selected as the test field, and three multi-temporal RADARSAT fine-mode images, taken on Apr, 8, May 26 and June 19, were used as the test data. From the first two temporal data, SAR backscatter intensity in rice-planted fields was found to decrease significantly from Apr. 8 to May 26. From the last two temporal data, SAR backscatter intensity increased significantly from May 26. From the last two temporal data, SR backscatter intensity increased significantly from May 26 to June 19 due to the growth of planted rice. We evaluated the actual performance for rice area estimation by above three RADARSAT data by comparing with the estimated area by SPOT multi-spectral data and also with National Digital Land Information.
1. Introduction
Rice is the most important agricultural product in Japan and a lot of man-power is still necessary to estimate rice planted areas in whole areas of Japan every year. Satellite remote sensing images, such as Landsat TM or SPOT HRV, have been expected to be used to estimate rice-planted areas. However, these optical sensors hardly have been able to get necessary data at a suitable timing due to cloud cover problem during rice planting season in Japan. Therefore currently only space-borne synthetic aperture radar (SAR) images might be practical data sources to realize rice area esimation by remote sensing in Japan.
According to high sensitivity of C-band radar image to surface roughness conditions, the backscatter intensity of RADARSAT images changes greatly from non-cultivated bare soil condition before rice planting to inundated condition just after rice planting (Suga et al, 1999). In addition, RADARSAT images are rather sensitive to the change of rice biomass in a growing period of rice (Ribbes et al, 1999 and Liew et al, 1999). Therefore, rice area estimation is expected to be realized in an early stage, namely only after rice planting or earlier than one month after rice planting. The authors attempted to estimate rice-planted areas using month after rice planting. The authors attempted to estimate rice-planted areas using month after rice planting. The authors attempted to estimate rice-planted areas using RADARSAT fine-mode data in an early stage after rice planting and evaluated the actual RADARSAT fine-mode data in an early stage after rice planting and evaluated the actual performance for rice area estimation by above three RADARSAT data by comparing with the estimated area by SPOT multi-spectral data and also with National Digital Land Information.
2. Test Site and Test Data
The eastern part of Hiroshima City, Higashi-Hiroshima City, was selected as the test field, and three multi-temporal RADARSAT fine-mode (FIF) images, taken on Apr. 8, May 26 and June 19 in 1999 were used as the test data. SPOT/HRV multi spectral data taken on June 21, 1999 were used to generate a reference image for rice-planted area extraction. The landuse data in the National Land Digital Information (NLDI) in the test site was also referred to compare rice field distribution with the result of rice planted areas by RADARSAT data.
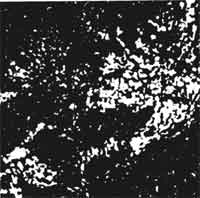
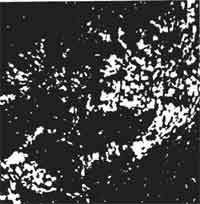
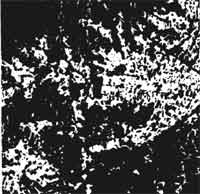
Above three RADARSAT and one SPOT images in a part of the test site are shown in Figure 1. The rice fields are mainly distributed in the middle-right and bottom-left portions in the images. The land surface condition of May 26 is almost smooth water surface just after rice planting, and that of June 19 is a mixed condition of growing rice and water surface. It is easily found that the rice fields are shown in a dark tone in the RADARSAT images on APR. 8 and June 19.
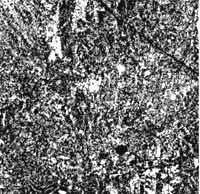 RADARSAT F1F Apr. 08, 1999 |
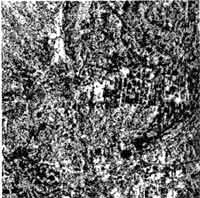 RADARSAT F1F May. 26, 1999 |
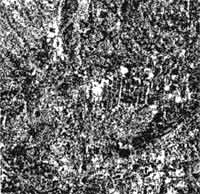 RADARSAT F1F June 19, 1999 |
 SPOT/HRV(Mu)-B3 June 21, 1999 |
| (RADARSAT Image :
@CSA&RADATSAT International 1999. SPOT Image: @ CNES
1999. Fig.1 Multi-temporal RADARSAT images and SPOT/HRV image in a part of test site. | |
3. Data Processing
3.1 Processing of RADARSAT Data
The RADARSAT data were processed from Level-0 by Vexcel SAR Processor (VSARP) and single-look power images with 6.25 meters ground resolution were generated. Then the power images were filtered using mean filter with 7 by 7 moving window and finally converted into 8-bits image data in which power level is represented in dB. All RADARSAT and SPOT images were overlaid onto the topographic map with 1:25,000 scale. As RADARSAT images are much distorted by foreshortening due to topography, the digital elevation model (DEM) with 50 meters spatial resolution issued by Geographical Survey Institute (GSI) of Japan was used to correct foreshortening of RADARSAT images.
Figure 2 shows the temporal changing patterns of RADARSAT backscatter of some typical land cover types. As the RADARSAT backscatter is not calibrated perfectly, the figure shows it by relative power level in dB. In Figure 2 only rice shows a significant change of backscatter due to the change of its surface condition described in the previous section, and this suggests that rice-planted areas are possible to be extracted using backscatter change in multi-temporal RADARSAT images.
Fig.2 Temporal changes of RADARSAT-FIF backscatter of several land cover types.
3.2 Extraction of Rice-Planted Areas
Rice-planted areas were extracted using two methods from RADARSAT images. One was thresholding and the other was supervised classification by maximum likelihood (ML) classifier. The thresholding is a simple one that is, a pixel is extracted as rice if the backscatter change of that pixel is larger than a certain threshold value. The data combinations for thresholding were three, the first one was Apr.8 - May 26 -June 19 and the third the combination of the first and the second. For the third case, rice-planted areas are extracted by AND operation of the areas by two data combinations (Apr.8 May 26-June 19).
The second method, ML classifier, conducted land cover classification including rice category using the merged images of three or two temporal RADARSAT images, namely three or two channel images in which each channel indicates each temporal image. The three channel means to use all three temporal images and the two channel means to use only Apr.8 and May 26 because the backscatter change of rice is larger in the first two images than in the last two images in Fig. 2. For SPOT/HRV, the same method, ML classifier, was used to classify several land over types including rice.
4. Experimental Result
4.1 Result of Rice-Plated Area Extraction
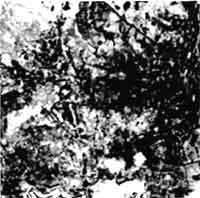
Figure 3 shows the examples of rice-planted area extraction by RADARSAT, SPOT and finally by NLDI-landuse in the same area as Finger 1. It should be noted that NLDI-landuse indicates landuse as rice-fields and does not mean that they are always planted. In addition, the data were generated in an older time, therefore, some rice-fields are possible to change into other landuses. Top-left result was obtained by the thresholding of Apr.8 and May 26 with threshold value of -3dB in RADARSAT backscatter. The top-right was obtained by the ML classifier of all three temporal RADARSAT images. The classification score for rice by RADARSAT was about 92 percent for both of two and three channel, while that of SPOT was almost the same as RADARSAT.
 RADARSAT Thresholding Apr-May :- 3dB |
 RADARSAT ML-classifier Apr.&May&June |
 SPOT/HRV ML-classifier June 21 |
 NLDI-landuse <rice-field> |
| Fig. 3 Results of rice-planted area extraction by RADARSAT (top-left and top-right), by SPOT (bottom-left), and by NLDI-landuse (bottom-right) | |
In Figure 3, the rice extracted areas in both of the two results by RADARSAT seem quite similar to those in the result by SPOT,. while those by RADARSAT and SPOT are much smaller than those by NLDI-landuse. One of the reasons for the difference is considered to be caused by the time difference between the two images described already, and the other is considered to be due to rought spatial resoluation (100 meters) of NLDI-landuse.
4.2 Quantitative Evaluatiion of Rice-Planted Area Extraction by RADARSAT
It is quite difficult to perform quantitative evaluation on the accuracy of rice-planted area extraction by RADARSAT because the rice areas extracted by both of SPOT and NLDI-landuse are also not perfect. However, the rice areas by SPOT are considered to be better than those by NLDI because of its fine ground resolution and synchronization of observation by RADARSAT and SPOT, although some miss-classification by SPOT should be taken account.
We defined two indices, true production rate (TPR) and false production rate (FPR) for rice areas by RADARSAT. TPR is the coincidence rate of rice areas by RADARSAT within those by SPOT and FPR is the rate of non-rice areas by SPOT within rice area by RADARSAT. As the rice area images extracted by RADARSAT are still contaminated by speckle noises as shown in Figure 3, the majority filter with 7 by 7 window was applied once or twice to the rice extracted images by RADARSAT before evaluation. The rice extracted image by SPOT was also filtered once by the same majority operation as RADARSAT to make the ground resolution compatible each other.
Table 1 show the result of TPR and FPR by the thresholding method for the data pair Apr. 8 and may 26. As the threshold value, -2dB, -3db and -4dB were set. Table 1 shows almost equal rate for TPR and FPR in all cases, in which he case with -3 dB threshold and filtering twice is the best for the value of TPR-FPR. No other data combination (namely (May 26-June 19)) could obtain the better result for TPR-FPR.
Table 2 shows the result by ML classifier of multi data RADARSAT data. The results are slightly better than those in Table 1. The best result for TPR-FPR was obtained by using all three data and filtering twice, although there are only small differences between two dates and three dates.
| Theshold Value | Filtering times | TPR (%) | FPR (%) | TPR -FPR |
| -2 dB | 1 | 53.3 | 54.0 | -0.7 |
| 2 | 52.2 | 47.4 | 4.8 | |
| -3dB | 1 | 42.2 | 39.9 | 2.3 |
| 2 | 40.2 | 34.5 | 5.7 | |
| -4dB | 1 | 31.3 | 31.6 | -0.3 |
| 2 | 28.8 | 28.1 | 0.7 |
(Thresholding of data on Apr.8 and May 26)
| used data | Filering TPR times | TPR (%) | FPR (%) | TPR -FPR |
| Apr. & May | 1 | 44.0 | 36.5 | 7.5 |
| 2 | 42.0 | 31.8 | 10.2 | |
| Apr. & May & June | 1 | 43.6 | 34.2 | 9.4 |
| 2 | 41.6 | 30.0 | 11.6 |
(ML classifer of multi-data data)
In general, the rice area extraction by RADARSAT did not give much high coincidence rate as that by SPOT in the quantitative evaluation. Over 50 percent of rice areas by SPOT were not extracted by RADARSAT and about 30 percent of the areas by RADARSAT were outside areas of rice by SPOT. This result suggests that there might be some limitation for the performance of rice-planted area extraction only by RADARSAT. Therefore, to realize a practical rice area estimation, a combination of RADARSAT and other data sources, for example, optical sensor images or other thematic maps based on ground survey should be considered.
5. Conclusions
Rice-planted area extraction was attempted using multi-temporal RADARSAT data taken in an early stage of rice growing season. The overall rice distribution patterns extracted by RADARSAT showed a farily good coincidence with those by SPOT/HRV data taken in almost same period of RADARSAT observation. However, by a quantitative evaluation, the rice areas by RADARSAT resulted in poor coincidence rate with those by SPOT.
As the result of this study, the possibly of RADARSAT for ricer area estimation was verified, especially, the possibility for estimation in a very early stage, namely just after rice plating, was verified, However, in the same time, some limitation for precise area estimation by RADARSAT was also revealed. Therefore, the further study on the practical for rice area estimation by remote sensing should be continued.
Acknowledgements
We thank to National Space Development Agency of Japan (NASDA) for the corporation in RADARSAT and SPOT data acquisition.
References
- Suga Y., Y. Oguro, S.Takeuchi and K.Tsuchiya, 1999. COMPARISION OF VARIOUS SAR DATA FOR VEGETATION ANALYSIS OVER HIROSHIMA CITY, Adv. Space Res. 23(8), pp. 1509-1516.
- Ribbes, F. and T.Le Toan, 1999. Rice Field mapping and monitoring with RADARSAT data, INT.J.R. REMOTE SENSING, 20(4), pp. 745-765.
- Liew, S.C., P.Chen et al, 1999. Changes in Rice Cropping System Using Space-Borne SAR Imagery, IGARSA'99 proceedings, pp. 741-743.