| GISdevelopment.net ---> AARS ---> ACRS 1999 ---> Poster Session 2 |
Research and Develop a
Satellite Remote Sensing Monitoring and Disaster Assessment System of
Sandstorm
Sun Siheng, Wang Guosheng,
Liao Yaping , Zhang Yuxing
(Academy of Forest Inventroy & Planning/China National Desertification Monitoring Centre, State Forestry Administation Beijing 100714 8610-84238053)
Zheng Xinjiang Luo Jingning Lu Wenjie
(China National Satellite Meteorology Centre Beijing 100081 8610-68406707)
Keywords:
Sandstorm Remote Sensing Monitoring System Disaster
Assessment(Academy of Forest Inventroy & Planning/China National Desertification Monitoring Centre, State Forestry Administation Beijing 100714 8610-84238053)
Zheng Xinjiang Luo Jingning Lu Wenjie
(China National Satellite Meteorology Centre Beijing 100081 8610-68406707)
Abstract
The paper is a draft introduction of the sandstorm disaster and the on-going development of "The Satellite Remote Sensing Monitoring and Disaster Loss Estimation " project. This project has been set up for promoting the spatial technology application in the efforts of preventing disaster and reducing disaster losses. In view of that sandstorm is a kind of nature disaster with small probability, huge harmfulness and caused by complicated factors, The research and development of this system is really a challenging task with a great practical value.
1. Significance of the system research and development
The sandstrom has always occurred in the areas of vast desert and seriously affected areas by desertification that is mainly caused by multiple natural and human factors. The sandstorm is an unexpected meteorogical disaster under a complicated natural condition and always led to a substantial devastating to the ecological environment and brought about tremendous social economic losses. However, owing to the worsening ecological environment, it has in turn promoted the possibility of the occurrence of the sandstorm. The China's northwest area is a part of the Central Asian sandstorm area in one of the Central Asian sandstorm area in one of the global four sandstorm regions. On May 5, 1993, a catastrophic sandstorm area is a part of the Central Asian sandstorm area in on e of the global four sandstorm regions. On May 5, 1993, a castastrophic sandstorm occurred in the northwest par t of China and contributed grave losses, meanwhile it has also raised the attention and concern of China Government as well as the whole society of the country. Since then, the Ministry of Forestry and related departments had in succession organized and completed a series research topics this regard. Owing to its proruption and a short sustained period of the sandstorm, it has therefore much difficult to make an exact monitoring and forecast for its occurrence. Furthermore, the sandstorm has always been occurred in the areas with poor traffic and communication conditions, and a strong process has always affected considerable regional scope. Thus, thus, the assessment with routine approach is hard to achieve the anticipated objectives and thereby a proper deployment for the disastrous relief activities has been seriously impacted. For promoting the role of remote sensing, GIS and network technology in disaster prevention and reduction, the Academy of Forest Inventory & Planning / the China National Desertification Monitoring Center, SFA and had undertaken the Project " Research and Development a Satellite Remote Sensing Monitoring and Disaster Assessment System of Sandstorm" In addition, the China National Satellite Meterological Center, Lanzhou Desert Institute and lnner Mongolian Forestry college also participated the activities of tackling some key technical problems and the system research and development.
2. Sandstorm and its classified criteria
Sandstorm is referred in particular to the disastrous weather phenomenon of the strong wind raising a cloud sand and dust from the ground, and the visibility is lower than 1000 meter. By research, it shows that drought, short of rain, frequent gale and unstable air as wide-spread desert, gobi and the desertified land were all provided abundant substantial sources for the sandstorm, plus the special natural conditions of topographic features and landform, it had composed of several major factors of the formation of the sandstorm.
In accordance with the criteria of WMO and based on the degree of the horizontal visibility, the strength, strength, moderate and light. The a\indicators of the corresponding visibility are separately as 50, 200, 500 and 1000 meters.
3. Source of remote sensing information and the key technologies
3.1The information source of remote sensing monitoring for the sandstorm
Since the frequented sandstorm areas have rare meterological stations, by using the meteorological satellite, by using the meteorological satellite to conduct remote seninsg monitoring, it should be of an effective approach. The NOAA/AVHRR data has a rather higher spatial resolution and if in an appropriate occasion, it can be effectively used for collecting the information of sandstorm. The geo-stationary meteorological satellite, such as GMS/VISSR data, has lower spatial resolution, but it can provide a sheet of 1/3 global disc picture per hour. It is quite suitable for real time detection and monitoring for sandstorm.
The CH1 and CH2 channels of NOAA/AVHRR are located at the visible and if in an appropriate occasion, it can be effectively used for collecting the information of sandstorm. The geo-stationary meteorological satellite, such as GMS/VISSR data, has lower spatial resolution, but it can provide a sheet of 1/3 global disc picture per hour. It is quite suitable for real time detection and monitoring for the sandstorm. The CH1 and CH2 channels of NOAA/AVHRR are located at the visible and near infrared waveband and can be used to measure and calculate the albedo of the underneath. The CH3, CH4, CH5 channels are the thermal infrared channels which can be used to measure and calculate the brightness temperature of the underneath. Since there are some differential in albedo and temperature for the sandstorm, the cloud system and the ground surface, thus the information of the sandstorm can be separated out from the satellite cloud image. The albedo data of the visible channel of GMS-5/VISSR has 64 grades, of which, the grade 0-47 reflect only the targets with low albedo, such as sandstorm and the ground surface, also, it has more meticulously distinguishing power. However, for the availability of the real albedo, it must do some additional work of corrections in the light of the change of the angle of depression.
3.2 Key technology for system research and development
- Research and development on the sandstorm monitoring and short-term early warming approach and its operational system,
- Research and development on the assessment approach for the disaster of sandstorm and its vocational operation system,
- The integration and test run of the sandstorm monitoring and disaster assessment system;
- Study on the formation of the sandstorm and its dangerous degree.
4.1.Technical scheme for the system
Taken the high-tech of modern geo-science, environmental remote sensing and remote telemetry, information science, systematic science and the computer technique as the technical means, based on the study of the environmental and meteorological factors of the happening and expanding of the sandstorm expecially, the cloud image of the sandstorm, it had worked out the criteria of the sandstorm grading, established the weather model of sandstorm and in combination of the analysis of the weather process and the results of numerical forecast, it has in early monitoring on the satellite cloud image detected the sandstorm and forecast the happening and expanding of the sandstorm, built the GIS data base of the land coverage and socio-environmental background for frequently occurring areas of sandstorm. Based on the study of the disaster behavior of the sandstorm, it had prepared the indicators for the assessment of the sandstorm. Through the satellite cloud image procuring the information of geographic scope and the strellite cloud image procuring the information of geographic scope and the strength of the sandstorm, and thereby conducting a real time assessment for the disaster and the losses caused b the sandstorm, and providing information to the command departments of disaster-relief and fighting against the calamities at all levels for reference in the process of decision-making.
4.2.The major targets of the system
- It should have the ability of early warning and implementing monitoring before the formation or in the early stage of the sandstorm disaster is formed.
- It should have the ability of timely providing the information of the happening and expanding of the sandstorm.
- It should have the ability of display the sandstorm affected scope by chart and the skill of cartographic output,
- It should also come to the prompt disaster assessment and with related information provide to the disaster relief and fight against the calamities departments. Submitting the report of the scope of the frequently-occurred areas of the sandstorm.
Application of the High-tech early warning (based on the model of weather forecast for the sandstorm, deciding the possibility of occurrence of the sandstorm, and tracing monitoring of its developing process); high-speed (it can made a quick response after several hours of the disaster is occurred and come to an initial conclusion), flexibility(it can operate around the clock and all the weather in any places), accuracy and reliability (positioning, quantifying, qualitative), integration (integrating the RS, GIS and computer network technique as a whole). The system has the following characteristics;
- Having a series of high-tech of remote sensing, GIS, computer network organically integrates with the ground observation and comprehensive application;
- Remote sensing, GIS and integration technique depend on each other and constitute a complete monitoring system;
- Applied computer technique and network technique have greatly promoted information transmission and its automatically, and can quickly conduct monitoring and assessment to the suddenly disaster of sandstorm.
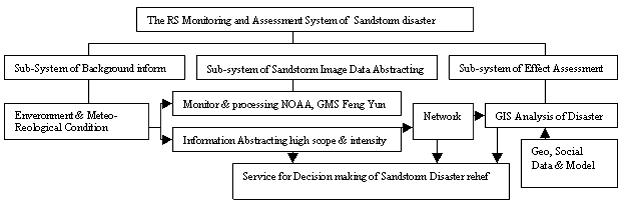
Flow Chart of Information & the System Operation
5.Pilot operation of the system and application examples
5.1 Sandstorm Monitoring in 15th April,1998 GMS-5 data of visible light and thermal Infrared channels in 15th -17th April were used to extract sandstorm information (see Picture l the red areas in white frame are the areas affected by sandstorm and float dust. Which were quite corresponding to be ground truth). In 15th April, 1998 effected by a developing Mongolia cyclone of temperate zone, a sandstorm of large scale appeared in south Mongolia and China's north (picture 1- a); 4 hours later, following the reinforce of cold front cloud land and swiftly pressing towards south, the sandstorm areas expended to the north of the yellow river bend and Ningxia. Gansu etc. (picture 1-b); 24 hours later, in 16th April floating dust formed and spreaded rapidly pushed forward east China by the high altitude northwest airflow and effected a large area of the Yangzi river valley (picture 1-c); in the morning of 17th by the influence of west in the back of ground cold front, the floating dust got into China;s east sea and yellow sea areas. It also affected Korea and Japan (picture 1 -d).
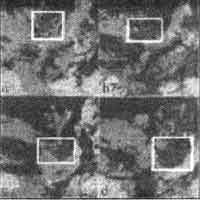
Picture 1 The GMS-5 Images of Sandstorm on 15th-17th April. 1999
5.2 Sandstorm monitoring and disaster assessment in 1999.
In the 1st January, 1999, a very strong sandstorm procedure happened at China's west Inner Mongolia and Gansu. It was two months earlier than the normal year. As soon as the project group abstracted the relevant sandstorm information through processing the satellite cloud images immediately, the information was released at the meterological decision-making service system and broadcasted at CCTV. After this one, in succession many times of sandstorm, raising dust and floating dust occurred in China's north and northwest in 4th, 11th, 24th April and 13th May etc. The project group pilot operated the system, one by one edited "The Brief Report of Sandstorm Disaster affecting Estimation by Satellite Remote Sensing" in real-time submitting to the Office of China National Committee for the IDNDR and the Department of Disaster and Social Rehief, Ministry of Civil Affairs etc. It would help the reduction of disaster losses and got good social benefits. For example, the third issue of the Brief Report analyzed as bellow By the affection of a very strong cold front cloud land from Xinjiang toward east, at the afternoon of 24th April, 1999 a sandstorm weather occurred in a huge area of west, east and south Xinjiang, west Gansu and northwest Qinghai provinces. Occurring to our satellite remote sensing monitoring, this disaster affected about millions of people and vast land area. Among it a large areas of cultivated land and grassland were affected. The figure could be break down in each province and county Although this disaster mainly passed desert region but also harmed large areas of oasis farmland and grazing land in south Xinjiang, Tolufan basin, Yili river valley and the reclamation area of Shule river region. These areas are of Shule river region. These areas are main production region of crop, cotton, oil, best variety of fruits and melons, as well as best animal husbandry region. When the sandstorm happened it was just the time of Those crop seeds and fruit trees sprouted. This brought about a fierce attack on vast area of cropland, grassland, residential district and roads etc. It would cause a rather big economic loss. The picture 2 shows the special processed images of 24th April, 1999 at 16 o'clock (Beijing time). The golden-brown color areas are the affected regions of sandstorm and raising dust by remote sensing monitoring. The picture 3 shows the affected administration region of sandstorm and raising dust edited by GIS according to the information got from NOAA data mentioned above. This sandstorm weather procedure also influenced part region of Hazakstine and Mongolia.
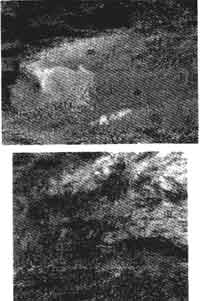
Picture 2 NOAA of 24th April 1999
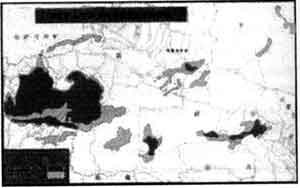
Picture 3 Map of Sandstrom and Raising dust Areas on 24th April 1999.
6.Conclusion
It is a very efficient method to monitoring sandstorm disaster by using satellite remote sensing, GIS and computer network technologies. The development and pilot operation of the project system would play a positive role in disaster prevention and relief of sandstorm. Though some technical progress has been made in this field, several key techniques should be still research on and the system should be integrated and more properly too. The project group now continuously work hard to fulfill this challenge task. Through this efforts to make more achievements by application of such high technologies as satellite remote sensing, GIS and computer network etc.