| GISdevelopment.net ---> AARS ---> ACRS 1999 ---> Poster Session 2 |
Dynamic Monitoring and Damage
Evaluation Of Flood in Northwest Jilin with Remote Sensing
Liu Zhaoli, Huang Fang, Li
Linyi , Wan Enpu
(Changchun Institute of Geography, CAS, Changchun 130024)
E-mail:mailto:geoinfo@public.cc.jl.cn
(Changchun Institute of Geography, CAS, Changchun 130024)
E-mail:mailto:geoinfo@public.cc.jl.cn
Key words: Dynamic monitoring of flood,
Automatic tracing, Damage evaluation
Abstract
The greatest flood in the 20th century hit Northeast China in the summer of 1998. The movement of the flood over the Nenjiang River drainage area in the northwest of Jilin province was dynamically monitored using Radarsat data; with the landcover map at the scale of 1:100000, interpreted from Landsat TM images, the damages from the flood were also evaluated. In this paper, a technique, similar to MVC (Maximum Value Composite) used to remove cloud contamination on NOAA AVHRR images, was applied to correct the logical errors on the flood boundaries extracted at different time. In addition the flood boundaries were vectorized via automatic tracing method, therefore the dynamic monitoring of the flood spatial process was performed better and the information of the changing inundated areas was offered more rapidly. The method produced in the study proved to be an effective approach to dynamic monitoring of flood.
1. Introduction
In the summer of 1998, there was a cataclysm over the whole drainage area of the Nenjiang River. The long duration and expansive area of the flood are rare in its history. It is very important to get dynamic flood information promptly and accurately for safety of life and property. Radarsat data of the wide-scanning mode play a very important role in flood monitoring for their advantages of wide coverage, short cycle, all-weather, full-time and capability of distinguishing water from land. The fusion of multi-temporal radar images is useful for dynamic monitoring of flood, however it lacks the capability of offering flood area. Submerged area estimation and damage evaluation mainly depends on manual interpretation of radar images. Owing to its low efficiency, it is not easy to meet the demand for dynamic, quick and accurate acquirement of flood information. A more effective and practical method deserves probing, which can both analyze flood movement and evaluate damage.
2. Study area and flood process
As one of the main tributaries of the Songhua River, Nenjiang River rises in the Da Hinggan Mountains and the Xiao Hinggan Mountains and has many long branches, whose water system is characteristic of plumose shape. Its northern part is typical of mountain river. The Nenjiang River flows into the Songnen Plain at the Nirier Town, from where the floodplain develops well and swamps distribute widely.
The study area lies in the downstream area of the Nenjiang River Basin (Figure 1). Besides Nenjiang River, some other rivers including the Taoer and the Huolin River flow through the region as well. When flood occurs, the water of the Taoer River strengthens the flood of the Nenjiang River at Yueliangpao Lake. Located to the southwest of the Nenjiang River, the trails of Huolin River usually disappear in swamp areas and form stagnant water areas. When flood emerges, floodwater rushes into the Songhua River through Lake Chagan, thereafter, the downstream area of the Huolin River frequently suffers the flood.
Fig.1 The location of study area
In the summer of 1998, the Nenjiang River drainage area was hit by heavy rains, which led to three successive floods (from late June to middle July, late July to early August and late August to early September). During the second flood in midstream area and the third one in middle and downstream area of the Nenjiang River drainage basin, the flood exceeded the warning water level for a long time. Furthermore, the flood from the Taoer River converged into the one of the Nenjiang River many times. Besides the above causes many destruction of its dikes also related to the decrease of the forest coverage in the Da and Xiao Hinggan Mountains, the shortage and disrepair of the flood controlling projects along the banks. The Lahai Dike on the left bank of the Nenjiang River burst on Aug.13, and then the Tailai Dike collapsed on 15. The floodwater of 1.1 billion cubic meters gushed into Tailai County of Heilongjiang Province and Zhenlai County of Jilin Province. The tempestuous flood brought about huge damages.
3. Data and preprocess
TM data covering the study area were received from May 1995 to August 1996 and transformed into Albers Equal Area Conic Projection. After interactive interpretation of the mosaic TM image on computer screen, the landcover map was produced at the scale of 1:100000 and stored in ARC/INFO coverage format for the damage evaluation. The water system map was derived from the landcover map. The administration division map from available 1:100000 topographical maps were manually digitized and transformed to Albers Equal Area Conic projection.
The Radarsat data of wide-scanning mode with the work band of C were received on Aug. 16, 20, 23 and 29, 1998. They have been transformed from slang to ground range at the Ground Receiving Station of Satellite. Except for the Radarsat image on Aug. 9, the others covered the whole study area. With the false color composite TM images the geometric calibration of the Radarsat images was carried out. Owing to the special imaging mechanism, the radar image holds particular characteristics such as geometric distortion, radiation distortion and speckle phenomenon. Because of the slant range projection of radar image, the farther away from the nadir is, the larger the scale is. In this case the transformation from slant to ground range may keep each pixel with the area of 100m*100m. To get the accurate flood area, the software ENVI was used to transform the images to the Albers Equal Area Conic Projection. The ground control points were selected respectively from the TM and radar images. Water is easy to be identified whereas other objects are obscure for the coarse resolution of the radar image. Considering the flood expansion and change of water body boundary, the turns of main roads were chose as control points. The wrap method used was polynomial and the images were resampled by nearest neighbor method. The transformed radar images with the pixel size as large as that of TM image makes it easy to integrate them.
The antenna pattern causes different pixel values for same or similar objects in radar image and the radiation distortion occurs along the range, that is to say, the central part of the radar image is brightest and its brightness gradually decreases from the central line to its two sides. When the flood movement was monitored we found that the inundated areas held different pixel values. Antenna pattern correction was performed by polynomial fitting so that the signal intensities of the identical objects were similar in the monitoring area.
Figure 2. Location of water-land threshold profiles
Because the most distinctive characteristic of SAR is speckle, the Gamma Map filter was adopted to oppress the speckles, which can smooth the noises and maintain the edges well. The window of 9*9 could bring the better result.
The five radar images through noise removal were stretched, ranging from 0 to 255, for the extraction of flood information.
4.Method
4.1 Extraction of flood information
There is a clear distinction between water and surrounding objects on radar image. However, the transmission capability of radar results in smooth of echo signals along the flood boundary, which makes it difficult to determine the thresholds and decreases the accuracy of flood extraction. The Nenjiang River course near Yueliangpao Lake and the non-inundated areas along the left bank were picked out and several perpendicular lines were drawn down the river bank (see Figure 2). In the profile produced, where x-axis and y-axis respectively represent the vertical line and the intensity of radar echo, there exist the considerable differences of radar echoes between floodwater and non-inundated areas. The pixel values of water and its neighbor objects were averaged and the result was regarded as the threshold of land-flood discrimination (see Figure 3). After the five thresholds were calculated, the flood areas were extracted from the radar images. The useful method was validated through the field survey.
Figure 3. Profile of water-land threshold calculation
From the results of flood extraction the flood mask images were built, in which flooded area and the non-inundated area were evaluated 1 and 0 respectively. The water body information in normal years was extracted from the TM images using the maximum likelyhood classifier and the water mask image was also built. Owing to the limiting accuracy of control point selection and flood threshold calculation on those images, the errors of the radiation corrections for the antenna pattern on the radar images, the flood boundaries extracted from the multi-temporal Radarsat images contradicted each other sometime and somewhere, namely, the inundated areas on some image might be regarded as the non-inundated lands on the consequent ones. Such logical errors basically occurred on the boundary regions between inundated and non-inundated lands and should be corrected.
In the light of the logic errors, the idea, similar to MVC used to remove cloud contamination on NOAA images, was borrowed and applied. We numbered each radar image in the order of receiving time and evaluated the flood data by the following expression:
Pixel value of flood image = (6 - n) * 40 * m
where m indicates the mask image.
Table 1. The number of images
The pixel values of water body are 240 in normal year, the ones of the flooded regions are evaluated 200 in the image on Sept.9, 1998, and so on; the non-inundated area is 0. Six evaluated images were integrated to produce the composite image of the flood movement by selecting pixel with the highest value on the same spatial location.
4.2 Vectorization of flood images
Although the composite image can show the flood movement, it is necessary to vectorize the flood image for dynamic and accurate acquirement of the inundated areas and the damages from the floods. Due to the limitation such as temporal resolution of TM image and image classification technique, the manual interpretation was used to get the landcover map in vector format.
In this paper the automatic tracing method was Figure 3. Profile of water-land threshold calculation adopted to vectorize the flood boundaries. The low efficiency in interactively manual interpretation limits quick, dynamic and accurate acquirement of flood information. According to our experience, it takes at least three days for three people to interpret the flood boundaries on computer screens.
The tracing digitization was performed with the software Coreldraw7.0, whose trace module is very powerful. Control parameters can determine the tracing unit, that is, only the boundaries of the flood areas larger than a certain size can be traced, the smoothed curves may not only greatly compress data, but also bring a good visual effect.
Before the tracing digitization, the composite image ranging within 260-220, 220-180, 180-140, 140-100, 100-60, 60-20 is respectively encoded in binary format again. The pixel values of the image inside each range were evaluated 1 and the ones outside the range were altered 0. Six binary-value images can offer the information of normal water body and the flood on Aug.9, 16, 20, 20, 23 and 29 respectively. The flood areas smaller than 20 pixels were neglected and the smoothing parameter were 10. The graphics traced were transferred from the DXF format to the PC/ ARCINFO coverage and the attribute values were added to map units. Since number of non-inundated areas was small, first all the units were given the same attribute value, then the attributes of the non-inundated units were modified in ARC/VIEW. In the window environment the attributes of non-inundated units can be replaced easily.
Through above steps, six coverage files were produced, they may be utilized to extract the flood information in the study area.
4.3 Dynamic monitoring and damage evaluation of flood
The dynamic monitoring of flood requires the composition of multi-temporal flood maps. Five flood coverages in ARC/INFO were overlaid to create a composite map. The attribute table was joined with a new field for recording the first time when the map units suffered the flood, thus the expansion of flood area during two receiving dates can be detected. The map of administration division was overlaid with the composite map so that the dynamic flood area for each administration district can be calculated.
The map produced by automatic tracing of water body from the TM image holds more detailed information, however, the landcover map at the scale of 1:100000 was accomplished through the manual interpretation of the TM image, which was overlaid with the flood data for the damage evaluation. Therefore the former map had to be discarded and the map of the water body was extracted from the landcover one.
Damage evaluation of the flood is based on the overlaying between the landcover map and the one of flood dynamic process, which is performed only in an administration district for the limitations of software and hardware.
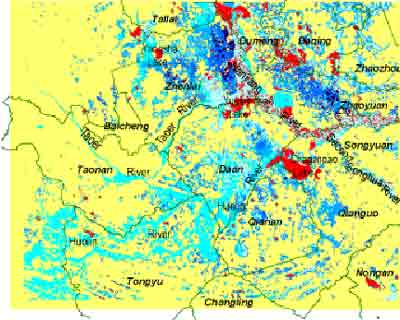
Figure 4. Flood process in the west of Jilin province in the summer of 1998
5.Result and discussion
Figure 4 shows the map overlaid between the water body and flood process ones, which presents the movement of the flood. In the map the most parts of the Huolin River and the Taoer River Basin were flooded on Aug.16. Actually, those regions had been flooded on Aug.9. Such inconsistency resulted from the partial unavailability of the radar data.
The usual shape of the Nenjiang River is narrow and tortuous, and many oxbow lakes are located in the riverbed. The riverbed was already submerged on Aug.9. With the flood rising, the floodplain and low terraces were drowned. The flood kept spreading until it reached the national dikes.
Zhenlai County of Jilin Province is located at the juncture of the western part of the Nenjiang River and the northern part of the Taoer River. Because the dike of the Nenjiang River in Tailai County broke on Aug.15, the flood moved south and entered into Zhenlai County on Aug.16. The central region of the county was submerged on Aug.20. Although the flood peak had passed on Aug.23, the flood continued spreading around, especially towards the Nenjiang River. Except for the submerged low lands, several plots of upland were isolated in the flood.
In the downstream area of the Huolin River and the surrounding areas of the Chagan Lake, where Danan, Qianan and Qianguo County are situated, the external flood converged with the internal one. The flood from the Huoklin River approached the Chagan Lake on Aug.9 and entered into the Lake on Aug.16. It kept expanding in both directions until Aug.20. After that the flood gradually subsided. The flood from the Taoer River joined with the one from the Nenjiang River at Yueliangpao Lake and continued expending around.
Fig.5 Dynamic increase of flooded areas in the counties of Northeast Jilin
Taonan and Tongyu County lie in the Taoer and the Huolin River Basin. The flood stopped spreading there on Aug.16 for their higher terrains. The dynamic extension of inundated area in northwestern counties of Jilin Province corresponding to time is illustrated in Figure 5. For the partial shortage of the radar data on Aug. 9, the inundated areas is 0 in Tongyu and Taonan County. Because the dike in Tailai County broke, the inundated area of Zhenlai County adjacent to Tailai County increased at the greatest rate and was above the ones of other counties. In addition, Daan, Qianan and Qianguo County situate in the downstream areas of the Taoer and the Huolin River near the Nenjiang River, thus, the increasing rates of the inundated areas were greater.
Fig.6 Dynamic changes of various landcover areas flooded in Zhenlai
Figure 6 shows the dynamic changes of landcover areas flooded during the monitoring periods in Zhenlai County. Due to its low elevation, the swamps were drowned first and their inundated area reached the top on Aug.9 and began to decrease afterwards. The saline lands with low terrain were drawn after the swamps were done, the maximum value occurred on Aug.20 for their higher terrain than swamp’s, the condition of the medium-density grasslands resembled the saline lands. Since dry land, paddy land and high-density grassland distribute on much higher uplands, their inundated areas reached the maximum until Aug.23. With the flood recession on Aug.29, the inundated areas began to decrease. The values listed in Table 2 indicate the damages in Zhenlai County.
Table.2 The inundated area of different landcover types in Zhenlai (Ha)
6.Conclusion
Radarsat data are very useful for flood monitoring. The paper demonstrates that multi-temporal Radarsat data of wide-scanning mode can be utilized to dynamically monitor the flood movement and evaluate the damages quickly and accurately. The conclusions drawn from the study are as follow:
Abstract
The greatest flood in the 20th century hit Northeast China in the summer of 1998. The movement of the flood over the Nenjiang River drainage area in the northwest of Jilin province was dynamically monitored using Radarsat data; with the landcover map at the scale of 1:100000, interpreted from Landsat TM images, the damages from the flood were also evaluated. In this paper, a technique, similar to MVC (Maximum Value Composite) used to remove cloud contamination on NOAA AVHRR images, was applied to correct the logical errors on the flood boundaries extracted at different time. In addition the flood boundaries were vectorized via automatic tracing method, therefore the dynamic monitoring of the flood spatial process was performed better and the information of the changing inundated areas was offered more rapidly. The method produced in the study proved to be an effective approach to dynamic monitoring of flood.
1. Introduction
In the summer of 1998, there was a cataclysm over the whole drainage area of the Nenjiang River. The long duration and expansive area of the flood are rare in its history. It is very important to get dynamic flood information promptly and accurately for safety of life and property. Radarsat data of the wide-scanning mode play a very important role in flood monitoring for their advantages of wide coverage, short cycle, all-weather, full-time and capability of distinguishing water from land. The fusion of multi-temporal radar images is useful for dynamic monitoring of flood, however it lacks the capability of offering flood area. Submerged area estimation and damage evaluation mainly depends on manual interpretation of radar images. Owing to its low efficiency, it is not easy to meet the demand for dynamic, quick and accurate acquirement of flood information. A more effective and practical method deserves probing, which can both analyze flood movement and evaluate damage.
2. Study area and flood process
As one of the main tributaries of the Songhua River, Nenjiang River rises in the Da Hinggan Mountains and the Xiao Hinggan Mountains and has many long branches, whose water system is characteristic of plumose shape. Its northern part is typical of mountain river. The Nenjiang River flows into the Songnen Plain at the Nirier Town, from where the floodplain develops well and swamps distribute widely.
The study area lies in the downstream area of the Nenjiang River Basin (Figure 1). Besides Nenjiang River, some other rivers including the Taoer and the Huolin River flow through the region as well. When flood occurs, the water of the Taoer River strengthens the flood of the Nenjiang River at Yueliangpao Lake. Located to the southwest of the Nenjiang River, the trails of Huolin River usually disappear in swamp areas and form stagnant water areas. When flood emerges, floodwater rushes into the Songhua River through Lake Chagan, thereafter, the downstream area of the Huolin River frequently suffers the flood.
Fig.1 The location of study area
In the summer of 1998, the Nenjiang River drainage area was hit by heavy rains, which led to three successive floods (from late June to middle July, late July to early August and late August to early September). During the second flood in midstream area and the third one in middle and downstream area of the Nenjiang River drainage basin, the flood exceeded the warning water level for a long time. Furthermore, the flood from the Taoer River converged into the one of the Nenjiang River many times. Besides the above causes many destruction of its dikes also related to the decrease of the forest coverage in the Da and Xiao Hinggan Mountains, the shortage and disrepair of the flood controlling projects along the banks. The Lahai Dike on the left bank of the Nenjiang River burst on Aug.13, and then the Tailai Dike collapsed on 15. The floodwater of 1.1 billion cubic meters gushed into Tailai County of Heilongjiang Province and Zhenlai County of Jilin Province. The tempestuous flood brought about huge damages.
3. Data and preprocess
TM data covering the study area were received from May 1995 to August 1996 and transformed into Albers Equal Area Conic Projection. After interactive interpretation of the mosaic TM image on computer screen, the landcover map was produced at the scale of 1:100000 and stored in ARC/INFO coverage format for the damage evaluation. The water system map was derived from the landcover map. The administration division map from available 1:100000 topographical maps were manually digitized and transformed to Albers Equal Area Conic projection.
The Radarsat data of wide-scanning mode with the work band of C were received on Aug. 16, 20, 23 and 29, 1998. They have been transformed from slang to ground range at the Ground Receiving Station of Satellite. Except for the Radarsat image on Aug. 9, the others covered the whole study area. With the false color composite TM images the geometric calibration of the Radarsat images was carried out. Owing to the special imaging mechanism, the radar image holds particular characteristics such as geometric distortion, radiation distortion and speckle phenomenon. Because of the slant range projection of radar image, the farther away from the nadir is, the larger the scale is. In this case the transformation from slant to ground range may keep each pixel with the area of 100m*100m. To get the accurate flood area, the software ENVI was used to transform the images to the Albers Equal Area Conic Projection. The ground control points were selected respectively from the TM and radar images. Water is easy to be identified whereas other objects are obscure for the coarse resolution of the radar image. Considering the flood expansion and change of water body boundary, the turns of main roads were chose as control points. The wrap method used was polynomial and the images were resampled by nearest neighbor method. The transformed radar images with the pixel size as large as that of TM image makes it easy to integrate them.
The antenna pattern causes different pixel values for same or similar objects in radar image and the radiation distortion occurs along the range, that is to say, the central part of the radar image is brightest and its brightness gradually decreases from the central line to its two sides. When the flood movement was monitored we found that the inundated areas held different pixel values. Antenna pattern correction was performed by polynomial fitting so that the signal intensities of the identical objects were similar in the monitoring area.
Figure 2. Location of water-land threshold profiles
Because the most distinctive characteristic of SAR is speckle, the Gamma Map filter was adopted to oppress the speckles, which can smooth the noises and maintain the edges well. The window of 9*9 could bring the better result.
The five radar images through noise removal were stretched, ranging from 0 to 255, for the extraction of flood information.
4.Method
4.1 Extraction of flood information
There is a clear distinction between water and surrounding objects on radar image. However, the transmission capability of radar results in smooth of echo signals along the flood boundary, which makes it difficult to determine the thresholds and decreases the accuracy of flood extraction. The Nenjiang River course near Yueliangpao Lake and the non-inundated areas along the left bank were picked out and several perpendicular lines were drawn down the river bank (see Figure 2). In the profile produced, where x-axis and y-axis respectively represent the vertical line and the intensity of radar echo, there exist the considerable differences of radar echoes between floodwater and non-inundated areas. The pixel values of water and its neighbor objects were averaged and the result was regarded as the threshold of land-flood discrimination (see Figure 3). After the five thresholds were calculated, the flood areas were extracted from the radar images. The useful method was validated through the field survey.
Figure 3. Profile of water-land threshold calculation
From the results of flood extraction the flood mask images were built, in which flooded area and the non-inundated area were evaluated 1 and 0 respectively. The water body information in normal years was extracted from the TM images using the maximum likelyhood classifier and the water mask image was also built. Owing to the limiting accuracy of control point selection and flood threshold calculation on those images, the errors of the radiation corrections for the antenna pattern on the radar images, the flood boundaries extracted from the multi-temporal Radarsat images contradicted each other sometime and somewhere, namely, the inundated areas on some image might be regarded as the non-inundated lands on the consequent ones. Such logical errors basically occurred on the boundary regions between inundated and non-inundated lands and should be corrected.
In the light of the logic errors, the idea, similar to MVC used to remove cloud contamination on NOAA images, was borrowed and applied. We numbered each radar image in the order of receiving time and evaluated the flood data by the following expression:
where m indicates the mask image.
| IMAGE TYPE | TM | RADARSAT | ||||
| Receiving Date | May-August/1996-1997 | Aug.9 1998 | Aug.16 1998 | Aug.20 1998 | Aug.23 1998 | Aug.29 1998 |
| No. (n) | 0 | 1 | 2 | 3 | 4 | 5 |
Table 1. The number of images
The pixel values of water body are 240 in normal year, the ones of the flooded regions are evaluated 200 in the image on Sept.9, 1998, and so on; the non-inundated area is 0. Six evaluated images were integrated to produce the composite image of the flood movement by selecting pixel with the highest value on the same spatial location.
4.2 Vectorization of flood images
Although the composite image can show the flood movement, it is necessary to vectorize the flood image for dynamic and accurate acquirement of the inundated areas and the damages from the floods. Due to the limitation such as temporal resolution of TM image and image classification technique, the manual interpretation was used to get the landcover map in vector format.
In this paper the automatic tracing method was Figure 3. Profile of water-land threshold calculation adopted to vectorize the flood boundaries. The low efficiency in interactively manual interpretation limits quick, dynamic and accurate acquirement of flood information. According to our experience, it takes at least three days for three people to interpret the flood boundaries on computer screens.
The tracing digitization was performed with the software Coreldraw7.0, whose trace module is very powerful. Control parameters can determine the tracing unit, that is, only the boundaries of the flood areas larger than a certain size can be traced, the smoothed curves may not only greatly compress data, but also bring a good visual effect.
Before the tracing digitization, the composite image ranging within 260-220, 220-180, 180-140, 140-100, 100-60, 60-20 is respectively encoded in binary format again. The pixel values of the image inside each range were evaluated 1 and the ones outside the range were altered 0. Six binary-value images can offer the information of normal water body and the flood on Aug.9, 16, 20, 20, 23 and 29 respectively. The flood areas smaller than 20 pixels were neglected and the smoothing parameter were 10. The graphics traced were transferred from the DXF format to the PC/ ARCINFO coverage and the attribute values were added to map units. Since number of non-inundated areas was small, first all the units were given the same attribute value, then the attributes of the non-inundated units were modified in ARC/VIEW. In the window environment the attributes of non-inundated units can be replaced easily.
Through above steps, six coverage files were produced, they may be utilized to extract the flood information in the study area.
4.3 Dynamic monitoring and damage evaluation of flood
The dynamic monitoring of flood requires the composition of multi-temporal flood maps. Five flood coverages in ARC/INFO were overlaid to create a composite map. The attribute table was joined with a new field for recording the first time when the map units suffered the flood, thus the expansion of flood area during two receiving dates can be detected. The map of administration division was overlaid with the composite map so that the dynamic flood area for each administration district can be calculated.
The map produced by automatic tracing of water body from the TM image holds more detailed information, however, the landcover map at the scale of 1:100000 was accomplished through the manual interpretation of the TM image, which was overlaid with the flood data for the damage evaluation. Therefore the former map had to be discarded and the map of the water body was extracted from the landcover one.
Damage evaluation of the flood is based on the overlaying between the landcover map and the one of flood dynamic process, which is performed only in an administration district for the limitations of software and hardware.
 |
|
Figure 4. Flood process in the west of Jilin province in the summer of 1998
5.Result and discussion
Figure 4 shows the map overlaid between the water body and flood process ones, which presents the movement of the flood. In the map the most parts of the Huolin River and the Taoer River Basin were flooded on Aug.16. Actually, those regions had been flooded on Aug.9. Such inconsistency resulted from the partial unavailability of the radar data.
The usual shape of the Nenjiang River is narrow and tortuous, and many oxbow lakes are located in the riverbed. The riverbed was already submerged on Aug.9. With the flood rising, the floodplain and low terraces were drowned. The flood kept spreading until it reached the national dikes.
Zhenlai County of Jilin Province is located at the juncture of the western part of the Nenjiang River and the northern part of the Taoer River. Because the dike of the Nenjiang River in Tailai County broke on Aug.15, the flood moved south and entered into Zhenlai County on Aug.16. The central region of the county was submerged on Aug.20. Although the flood peak had passed on Aug.23, the flood continued spreading around, especially towards the Nenjiang River. Except for the submerged low lands, several plots of upland were isolated in the flood.
In the downstream area of the Huolin River and the surrounding areas of the Chagan Lake, where Danan, Qianan and Qianguo County are situated, the external flood converged with the internal one. The flood from the Huoklin River approached the Chagan Lake on Aug.9 and entered into the Lake on Aug.16. It kept expanding in both directions until Aug.20. After that the flood gradually subsided. The flood from the Taoer River joined with the one from the Nenjiang River at Yueliangpao Lake and continued expending around.
Fig.5 Dynamic increase of flooded areas in the counties of Northeast Jilin
Taonan and Tongyu County lie in the Taoer and the Huolin River Basin. The flood stopped spreading there on Aug.16 for their higher terrains. The dynamic extension of inundated area in northwestern counties of Jilin Province corresponding to time is illustrated in Figure 5. For the partial shortage of the radar data on Aug. 9, the inundated areas is 0 in Tongyu and Taonan County. Because the dike in Tailai County broke, the inundated area of Zhenlai County adjacent to Tailai County increased at the greatest rate and was above the ones of other counties. In addition, Daan, Qianan and Qianguo County situate in the downstream areas of the Taoer and the Huolin River near the Nenjiang River, thus, the increasing rates of the inundated areas were greater.
Fig.6 Dynamic changes of various landcover areas flooded in Zhenlai
Figure 6 shows the dynamic changes of landcover areas flooded during the monitoring periods in Zhenlai County. Due to its low elevation, the swamps were drowned first and their inundated area reached the top on Aug.9 and began to decrease afterwards. The saline lands with low terrain were drawn after the swamps were done, the maximum value occurred on Aug.20 for their higher terrain than swamp’s, the condition of the medium-density grasslands resembled the saline lands. Since dry land, paddy land and high-density grassland distribute on much higher uplands, their inundated areas reached the maximum until Aug.23. With the flood recession on Aug.29, the inundated areas began to decrease. The values listed in Table 2 indicate the damages in Zhenlai County.
| Aug.9 | Aug.16 | Aug.20 | Aug.23 | Aug.29 | |
| Forest Land | 5924 | 1324 | 3821 | 3700 | 1755 |
| High-density Grassland |
7119 | 21567 | 102926 | 36210 | 19142 |
| Middle-density Grassland |
27315 | 62834 | 148352 | 246162 | 85904 |
| Low-density Grassland |
24390 | 13181 | 41691 | 18418 | 10350 |
| Floodplain Land | 4424 | 0 | 0 | 0 | 0 |
| Settlement | 2391 | 2027 | 10996 | 10910 | 4602 |
| Saline | 122174 | 294203 | 661452 | 138713 | 28226 |
| Swamp | 786610 | 176121 | 161656 | 85619 | 34496 |
| Paddy | 368 | 2086 | 10370 | 42827 | 34676 |
| Dry land | 31599 | 56030 | 60762 | 144116 | 72627 |
Table.2 The inundated area of different landcover types in Zhenlai (Ha)
6.Conclusion
Radarsat data are very useful for flood monitoring. The paper demonstrates that multi-temporal Radarsat data of wide-scanning mode can be utilized to dynamically monitor the flood movement and evaluate the damages quickly and accurately. The conclusions drawn from the study are as follow:
- According to the characteristics of wide-scanning radar data and the region features in Northwest Jilin, the data preprocesses of the multi-temporal Radarsat images were carried out. The flood information was extracted from them, not only were the flood areas vectorized through automatic tracing, but also the attributes of the features in the flood process maps were quickly added. Owing to its higher precision and efficiency, the method can be adopted to acquire quick and accurate flood information.
- The limits of process techniques led to some logical inconsistencies between different temporal flood images. An approach similar to MVC, which is often used to remove cloud contamination on NOAA images, is proposed to evaluate the flood pixels of different temporal flood images. When the multi-temporal flood images were integrated, the maximum value at the same location was selected, thereafter the errors of flood boundaries were avoided.
- The landcover map is overlaid with the multi-temporal flood maps so that the dynamic monitoring of the flood movement and the damage change can be performed better. In contrast to the fusion of multi-temporal radar images, the map of flood monitoring from multi-temporal Radarsat image is more suitable dynamically to analyze the flood process and damages quantitatively.
- The author wish to thank the Institute of Remote Sensing Application, Chinese Academy of Sciences and Ground Receiving Station of Satellite for their providing multi-temporal radar data. Contributions of Prof. Hua Runkui and Prof. Sun Guangyou were notably appreciated.