| GISdevelopment.net ---> AARS ---> ACRS 1999 ---> Poster Session 2 |
Development of a model of
radiation balance near ground level and application to satellite data
analysis
Kanako MURAMATSU1, Anna
Beata ADAMZYK** And Noboru FUJIWARA1*
*Department of Information and Computer Sciences,Nara Women’s University
Kitauoya-Nishi-Machi, Nara, 630-8506, Japan
Tel: (81) –742-20-3936 Fax: (81)-742-20-3434
E-mail: muramatu@ics.nara-wu.ac.jp
**Institute of Geography and spatial Organization Polish Academy of Science
Abstract*Department of Information and Computer Sciences,Nara Women’s University
Kitauoya-Nishi-Machi, Nara, 630-8506, Japan
Tel: (81) –742-20-3936 Fax: (81)-742-20-3434
E-mail: muramatu@ics.nara-wu.ac.jp
**Institute of Geography and spatial Organization Polish Academy of Science
We have developed a model of radiation balance near ground level for application to satellite data. To apply the model to data, we measured air temperature, surface temperature, humidity and wind velocity every hour for 24 hours on concrete, asphalt, soil, grass and trees. In addition to these temporal measurements, we installed a station on the rooftop of Nara Women’s University for measurements of air temperature, surface temperature and humidity using a logger. We applied the model to ground measurement data. The model works well for concrete, asphalt, soil and grass. In addition to ground measurement data analysis, we have included some results of preliminary research using satellite data.
1. Introduction
Air temperature and surface temperature are important parameters for environmental studies and monitoring the energy cycle for land area. The ground surface exchanges energy with air as sensible heat or latent heat. Sensible heat is important especially for urban area environmental studies. The energy is directly transferred from heated surface to air and raised the air temperature. Latent heat is important expecially for vegetation area environmental studies. The energy is taken away by evaporation and the air temperature around the area is not raised.
Using satellite data, our ultimate objective is to make images of sensible heat flux latent heat flux and air temperature. The first aim of this study is to develop a model of radiation balance near ground level. Our second aim is to develop a method for applying the model to satellite data.
In this paper, we report the model of radiation balance near ground level and the results of research using satellite data.
2. A model of radiation balance near ground level
We considered the radiation balance on the ground and in an elementary slab of atmosphere of thickness dz at altitude z (Houghton, 1986). We simplify the situation by assuming 1) that there is no cloud,2 ) a plane parallel atmosphere uniform in the horizontal, 3) that the air density is uniform in the vertical near ground. We define the altitude z as from 0 (which is the ground to (which is the top of the atmosphere).
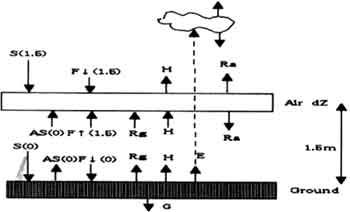
Figure1 : radiation balance near surface
2.1 The balance of radiation near the ground level
At first, we considered the balance of radiation near ground level. The incoming solar radiation at time t (S(t,0) (Wm-2)) plus the infrared radiation from the atmosphere at time t(F (t,0) (Wm-2)) directed downward from the atmosphere equal the infrared radiation emitted by the ground (Rg(t,0)(Wm-2)) plus the near-ground-surface conductive heat flux in the ground (G(t,0)(Wm-2)) plus the sensible heat flux to the atmosphere (H(t,0)(Wm-2)) plus the latent heat flux to the atmosphere (E(t,0) (Wm-2)).

Here, A is the surface albedo in the spectral range from visible to near infrared. If the surface temperature is Ts(t,0), Rg(t,0) is esT4s (t,0), where e is the emissivity of the ground, and s is the Stefan-Boltzmann constant, 5.67 x 10⁻⁸ Jm-2s-1deg-4.The phase difference between solar radiation and surface temperature is denoted by d. It is nearly 2 ~ 3 hours in summer. The conductive heat in the ground caused the delay. The pahse of conductive heat flux in the ground on the ground surface (z =0) is nearly the same as that of solar radiation. The phase difference d is also used for the conductive heat flux.
2.2 The balance of radiation at altitude z = 1.5m
Next, we considered the balance of radiation in an elementary slab of atmosphere of thickness dz at altitude z. The slab absorbs the incoming solar radiation (S(t,z) (Wm-2)), the infrared radiation from the atmosphere directed downward (F¯(t,z)), the infrared radiation from the atmosphere directed upward (F(t,z)), the infrared radiation emitted by the ground (Rg(t,z) (Wm-2)), the solar radiation reflected by the ground (S(t,0) (Wm-2)), the downward infrared radiation from the atmosphere reflected by the ground (F¯¯(t,0)) and the sensible heat flux from the ground to the atmosphere (H(t,z)(Wm-2)). The slab emits infrared radiation downward (Ra¯ = Kinf rsTa4 (t,z) 5/3 dz) and upward (Ra).
Here r(Kgm-3) is the density of absorber of the infrared radiation, kvis and kinf are the absorption coefficients for solar radiation and infrared radiation emitted by the ground surface or air, respectively. A mean thickness 5/3 dz is used for hemispheric radiation.
2.3 Air temperature and surface temperature
Near the ground surface, F¯(t,z) + F- (t,z) = F¯ (t,0), exp (-5/3kinf r(z)dz) 1 and S(t,z)= S(t,0) exp (kviss(z)dz) S(t,o). Using these Equations, we can obtain the model as follows:
|
| ||||||
| phase(hour) | cgrglg (J2s-1K-2m-4) |
b | W (ms-1) | Albedo | emissivity | |
| Concrete | 1.5 | 3.6x10⁶ | 0 | 2 | 0.306 | 1. |
| Asphalt | 1.5 | 1.0x10⁶ | 0 | 2 | 0.255 | 1. |
| Soil | 1.5 | 0.39x10⁶ | 0.1 | 2 | 0.239 | 1. |
| Grass | 0.5 | 0.39x10⁶ | 0.1 | 2 | 0.289 | 1. |
| Tree | 0.5 | 0.0 | 0.5 | 2 | 0.345 | 1. |
| Expected values | Fitting results | |||
| A | b | a | b | |
| concrete | 1 | -0.287 | 0.935 ±0.012 | -0.276 ±0.013 |
| asphalt | 1 | -0.315 | 0.959 ±0.016 | -0.224 ±0.017 |
| soil | 1 | -0.324 | 1.00 ±0.025 | -0.280 ±0.025 |
| grass | 1 | -0.296 | 1.105 ±0.033 | -0.373 ±0.033 |
| tree | 1 | -0.264 | 0.840 ±0.033 | -0.028 ±0.030 |
3. Data analysis for ground measurement data
Applying the model to the ground measurement data, we measured surface temperature, air temperature humidity and wind velocity on some types of ground objects on a fine day (no cloud). Data wee taken on concrete, asphalt, soil, grass and trees every hour for 24 hours on August 28 1997, January 10 1998 (Shiono, 1998), and March 2 1998. In addition to temporal measurement, data have been taken using a logger since August 1998 for concrete. The quantity of the solar irradiance was provided by Nara Meterological station.
The energy distribution for each radiation as a function of time is shown in Figure 2. Sensible heat flux latent heat flux and conductive heat flux are calculated using the formula described in Appendix. The phase difference d between solar radiation (or conductive heat in the ground) and surface temperature was assumed to be 1.5 hours for concrete, asphalt and soil and as a half hour for grass and a tree. The wind efficiency bis assumed to be 0.1 for soil and grass, and to be 0.5 for a tree. The wind velocity for sensible heat transfer is assumed to be 2 ms-1. One hour delay of the conductive heat phase is used especially for soil. The parameters used for the model Calculation are summarized in Table 1. The coefficients a and b are determined by the least-squared fit using daytime data. Expected values of a and be are summarized in Table 2.
Figure 2: Energy distribution of solar irradiacne, energy emitted from air and surface, sensible heat and conductive heat, and the least-squares fitting results for concrete, asphalt, soil, grass and a tree.
2. The results of fitting the data to a straight line are shown in Figure 2. Data is plotted with rhomus and the fitted results are shown with the dotted line. The results of the data measured for concrete, asphalt, soil, grass and trees on August 28 1997 are summarized in Table 2. For concrete, asphalt, soil and grass, the values of a and b of fitted results almost agree with the expected values within experimental errors. For soil and grass, the value of b is changed by the value of evaporation efficiency. For trees, the value b evaluated from the data are different from expected value. We measured the air temperature and the leaf temperature inside the canopy of the tree. This situation was different from the definitions of air and surface temperature in the model.
From these results, the model works well only for concrete, asphalt, soil and grass at ground level. For grass and soil, we have to introduce a new factor to estimate the evaporation efficiency. For the tree, we have to improve our measurement of temperature to satisfy the parameters of the model.
4. Satellite data Analysis
We used remote sensing data ovserved by a Thematic Mapper ™ sensor on board the LANDSAT satellite. The measured energy by TM sensor is affected by the atmosphere, which itself acts as an emitter. We recalibrated TM data using the relationship between the temperature measured at ground level and that measured by the TM sensor using the assumption of the atmospheric conditions being almost the same. The surface temperatures on the ground were measured at Tanabe Bay and on the roof of Nara Women’s University in Japan. Figure 3 shows the results of the relationship. X-axis shows the brightness temperature of the TM sensor (EOC, 1990) and Y-axis that of the ground measurement. For converting the surface temperature on the ground to the brightness temperature, the numerical values of emissivity 0.98 and 0.94 were used for water (Tanabe bay) and concrete (rooftop), respectively. Rhombi show the data points and the dotted line the results fitted to a straight line. The brightness temperature of TM data is recalibrated using the following relationship.
Figure 3 : Brightness temperature of TM data and that of the ground measurement data.

Using the relationship of Equation (4), the surface temperature of TM data measured on Aug. 2020 1995 is evaluated. Using the surface temperature measured by TM sensor, air temperature, and solar radiation measured by AMeDAS (Automated Meteorological Data Acquisition System), and the model, the maximum of sensible heat flux, conductive heat flux, latent heat flux in the day are estimated as shown in Figure 4 for non-vegetation area. Fore estimating the energy flux for vegetation area, we should improve the model of radiation balance.
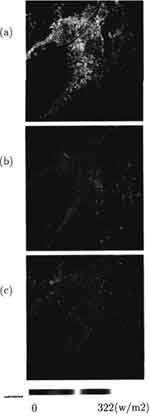
Figure 4 :(a) Sensible heat flux, (b) Conductive heat flux and (c) Latent heat flux on Aug. 20 1995, in Kansai area in Japan.
5. Conclusion
We have developed a model of radiation balance near ground level to estimate air temperature using surface temperature. To apply the model to data, we measured air temperature, humidity and wind velocity on concrete, asphalt, soil, grass and trees every hour 24 hours.
We applied the model to the ground measurement data. The model works well only for concrete, asphalt, soil and grass. We have to introduce new ideas for determination of evaporation efficiency and to improve measurements of air temperature and surface temperature for trees satisfy the parameters of the model.
Using the model for non-vegetation area, we estimated the maximum latent, conductive and sensitive and sensitive heat flux in the day. For estimating the energy flux, we should improve the model for vegetation area.
Acknowledgement
This work was supported by Grant-in-A 10780326 for Encouragement of Young Scientist, Japan Society for the Promotion of Science. The LANDSAT/TM and MSS data were provided by the Earth Observation Satellite Company (EOSAT) and National Space Development Agency (NASDA) in Japan. AMeDAS data was provided by Nara Branch, Japan Weather Association. The water temperature data measured at Tanable Bay was provided by Fisheries laboratory of Kinki University in Japan.
Reference
EARTH OBSERVATION CENTER, NATIONAL SPACE DEVELOPMENT AGENCY OF JAPAN, 1990, LANDSAT-5 data user’s HandBook (Remote Sensing Technology Center of Japan)
HOUGHTON, T.JOHN, 1996, The Physics of atmospheres, Cambridge University Press KAHLE, B. ANNE, 1977 A Simple thermal model of the erath’s surface for geologic mapping by remote sensing J. of Geophysical Research, Vol 82, No. 11,1673-1680.