| GISdevelopment.net ---> AARS ---> ACRS 1999 ---> Poster Session 2 |
New Method for Building
Collapse Risk Assessment Based on Damage Data due to The 1995 Kobe
Earthquake
Hiroyuki TANAKA, Osamu
MURAO and Fumio YAMAZAKI
Institute of Industrial Science
University of Tokyo
4-6-1, Komaba, Meguro-ku, Tokyo, 153-8505
Tel: (81)-3-5452-6408, Fax: (81)-3-3408-2666 E
http://www.gisdevelopment.net/aars/acrs/1999/ps2/tanaka@keikan.t.u-tokyo.ac.jp
Institute of Industrial Science
University of Tokyo
4-6-1, Komaba, Meguro-ku, Tokyo, 153-8505
Tel: (81)-3-5452-6408, Fax: (81)-3-3408-2666 E
http://www.gisdevelopment.net/aars/acrs/1999/ps2/tanaka@keikan.t.u-tokyo.ac.jp
Keydwords: Building Collapse Risk, the 1995 Kobe
Earthquake, Tokyo, Reliability Analysis, Fragility Curve
Abstract:
“The Earthquake Area Vulnerability Assessment of Tokyo”, which was published by Tokyo Metropolitan Government (TMG) recently, shows relative seismic risks in Tokyo. “The area danger levels” were determined with respect to building collapse, fire outbreak and spread, human casualties and access for evacuation, considering soil conditions, building inventory and social conditions. The method on the report was applied to Nada Ward, Kobe City using the inventory before the 1995 Hyogoken-Nanbu (Kobe) Earthquake. The obtained “building collapse risk” was compared with the actual damage of the ward due to the earthquake. The result of the comparison indicated that the weights used in the TMG method should be adjusted since the obtained collapse risk was strongly influenced by the building density of each city block. Then a revised method to evaluate “building collapse risk” was proposed. The new building collapse risk corresponds to the severe damage ratio of buildings and it reflects the characteristics of buildings and sites. The proposed method may be useful for seismic risk assessments by local governments in Japan.
1. Introduction
Since the 1995 Hyogoken-Nanbu Earthquake, many local and national governments of Japan have been more respected the studies of earthquake damage assessment. An earthquake causes fires, liquefaction, land slides and lifeline interruptions as well as damage to buildings and infrastructures. It is very important for local governments, not only of prefectures but also of cities or wards, to grasp seismic vulnerability of each city block. Recent GIS technologies enable us to assess seismic risk and to predict earthquake damage visually considering several kinds of inventories and other natural and social data.
This study deal with building collapse risk in “The Earthquake Area Vulnerability Assessment of Tokyo” [TMG, 1998]. This assessment is different from damage assessments for scenario earthquakes [TMG, 1997] in these points: (1) The former assumes no specific earthquake source model. (2) Rather simple model is used in the former.
In this study, in order to examine the assessment method of building collapse risk due to earthquakes, the method used in the TMG’s report was applied to the Nada Ward, Kobe City using building inventory before the 1995 Kobe Earthquake. The obtained “building collapse risk” was compared with the actual damage of the ward due to the earthquake and a revised method to estimate “building collapse risk” which fits the actual damage was proposed.
2. Application of the TMG Method to Nada Ward
2. 1 Building Collapse Risk by the Method of TMG
The building collapse risk by the method classified all the district blocks in Tokyo into five levels due to the amount of risk calculated with weights for building characteristics and site characteristics. These elements are determined by experiences of six professionals considering seismic vulnerability of buildings. The amount of risk (simply call "risk" hereafter) for building collapse was calculated by the following equations (1) and (2):
Qkn = Dk (1-Wkn·Ukn) (1)
Uk n= u1 n·u2 n·u3 n·u4 n·u 5 n (2)
in which k is the building category (1-19), Q is the amount of risk, D is the number of buildings per 1 km2 , W is the weight for earthquake resistant capacity of buildings of the category k, U is the weight for site characteristics, ui's are the weights for subsurface condition (u1), for possibility of liquefaction (u2), for large-scale cut-and-fill (u3), for reclaimed land (u4), and for steep slope (u5), n is each value by the 6 specialists. By adding Qk’s for all the structural types in a block, the amount of risk for the block is evaluated.
2. 2 Comparison between Building Collapse Risk and Actual
The building collapse risk of the Nada Ward in Kobe City was calculated using the inventory and soil data by the method of TMG. Soil conditions of each district block in Nada Ward were classified within TMG’s classification in choosing similar conditions in order to use the weights. As a result, the building collapse risk was determined as shown in Figure 1(a). Figure 1(b) shows the ratio of severely damaged buildings due to the 1995 Kobe Earthquake investigated by Kobe City. It is noticed that the distribution of building collapse risk evaluated by the method of TMG (Figure 1(a)) and the density of buildings (Figure 1(c)) look quite similar. It is observed that these two factors, the building collapse risk and the actual severe damage ratio, are not highly related. Although the former is strongly influenced by the building density of each district block. “The collapse of a building” itself is usually not influenced by the density of buildings in an area. Hence a revised amount of risk, which divides the evaluated amount of risk (by TMG method) by the total number of buildings in the block, is proposed.
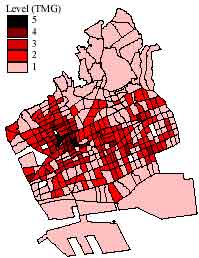
(a) Building collapse risk by the method of TMG
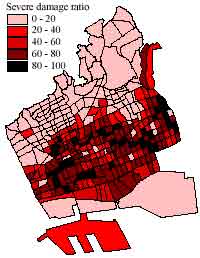
(b) Severe damage ratio of buildings due to the Kobe Earthquake
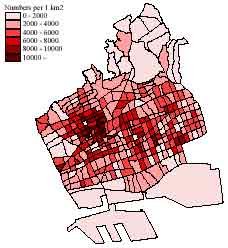
(c) Number of buildings
Figure 1: Building collapse risk and actual damage in Nada Ward
3. New Evaluation Method of Building Collapse Risk Compatible with Actual Damage Ratio
3. 1 Modifications to the Method of TMG
The above-mentioned study indicated the way to modify “building collapse risk” as an index that reproduces the actual severe damage ratio of buildings in Nada Ward due to the Kobe Earthquake. First, in equation (1), " Dk: the number of buildings per 1 km 2 " is replaced by "Nk: the ratio of buildings with category k in number". By this, the building collapse risk which reproduces the severe damage ratio can be obtained. Next, the weights used in equation (1) were examined. In the method of TMG, the weights for the seismic resistance of buildings and the site condition are simply multiplied when evaluating the collapse risk. However, the collapse risk may be affected by the both parameters at the same time. Hence matrix-type weights should be introduced to consider the joint effect of the building resistance and the site condition (intensity of strong motion) on the collapse risk.
3. 2 Method of New Building Collapse Risk Evaluation
A new building collapse risk evaluation method is proposed in this study. In the proposed method, "Pi: the building collapse risk" is defined in the following equation as an index instead of "the amount of risk" in the method of TMG.
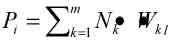
in which k is the building category (1-14), l indicates the subsurface soil condition (1-4), Nk is the ratio of buildings with category k in number, Wkl is the matrix-type weight for building category k and soil condition l. Classifying the collapse risk into 5 levels, a risk level of each block is obtained. By this equation (3), the effect of the building density is removed from the collapse risk evaluation, and more realistic risk that represents the building characteristics and site condition of an area can be calculated.
3. 3 Reliability Analysis to Obtain Damage Probability
In order to make the proposed method applicable to other areas in Japan, the matrix-type weights were determined by the basic reliability analysis theory. The vulnerability functions (fragility curves) of 14 building categories for severely damaged buildings developed by Murao and Yamazaki (2000) were used as the resistance of buildings. The values of the two parameters of the log-normal distributions are listed in Table 1.
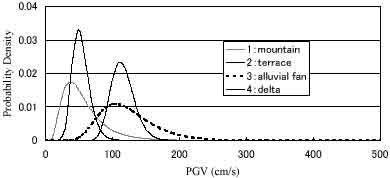
Figure 2: Probability density function of the estimated PGV in the 1995 Kobe Earthquake for different topographical conditions in Nada Ward
Figure 2 shows the probability density functions of the estimated PGV in the Kobe Earthquake for different topographical conditions in Nada Ward. These functions were also obtained by a statistical analysis of the estimated PGV values in Nada Ward and the values of their parameters are shown in Table 1. The PGV value is widely distributed for mountain and alluvial fan while the range is comparatively narrower for terrace and delta. But, of course, this observation is the case for Nada Ward in the Kobe Earthquake. It is necessary to assume these functions when applying to other areas.
Using the basic reliability analysis theory, the probability for severe damage Pf,which is the function of the matrix-type weights, is obtained by the following equation:
Pf = P (R/S<1) = 1-F(l z/xz) (4)
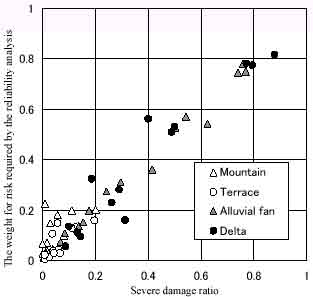
in which R is the seismic resistance of buildings, S is the strong motion index (e.g. PGV), Fis the cumulative probability of the standard normal distribution, lz= lr - ls, and xz = ( xr2 + xs2 ) 1/2 , assuming independence between R and S. Using this equation, the weights for the building collapse risk can be calculated and the values are shown in Table 1. Figure 3(a) plots the comparison of the weights for the building collapse risk evaluated by equation (4) and the severe damage ratio observed in the Kobe Earthquake. It is seen that the obtained weights are compatible with the actual severe damage ratio. The building collapse risk of Nada Ward calculated by this method is plotted in Figure 3(b). Comparing this figure with the distribution of severe damage ratio in Figure 1(b), they look quite similar. Thus, it is conducted that the severe damage ratio was almost reproduced by the proposed method.
Table 1: Parameters of the
probability density functions and obtained weights that reproduce the
severe damage ratios due to the Kobe Earthquake
(a)
(b)
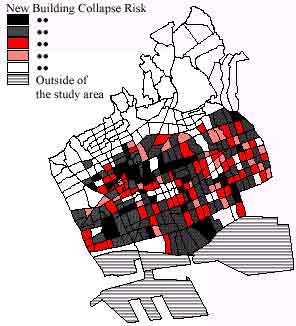
Figure 3: (a) Comparison between the actual severe damage ratio and the evaluated severe damage probability; (b) The proposed building collapse risk of Nada Ward
3. 4 New Building Collapse Risk of Tokyo
Reapplying the method proposed above to Tokyo, the building collapse risk in Tokyo was evaluated. In calculating the new building collapse risk, the median of PGV in mountain areas was assumed to be 30cm/s, which was used in the damage assessment study of TMG (1997) for near-field earthquakes. The median values of PGV in other topographical conditions were obtained by multiplying the amplification factors proposed by Yamazaki et al. (1999). The logarithmic standard deviation of PGV was assumed as the record-to-record (intra-event) variation in the attenuation relation of PGV proposed by Molas and Yamazaki (1995).
Under these assumptions, the new building collapse risk of Tokyo was calculated and it was compared with that by TMG as shown in Figure 4. It is seen in the figure that the risk level in the eastern part of Tokyo (lowland with soft soil) is large by the proposed method while the high-risk blocks are distributed outside of Yamanote Line circle (highly built-up wooden building areas) by the TMG method. Soil condition and building type are dominant factors to determine the collapse risk in the proposed method. However, since the Urban Planning Bureau of TMG uses this building collapse risk in the selection of areas for urban redevelopment, the risk by the TMG method may have different meaning from the risk evaluated by the proposed method.
(a) Building collapse risk by TMG (1998)
(b) Building collapse risk by the proposed method
Figure 4: Comparison of building collapse risk in Tokyo by two methods
4. Conclusions
In this study, the building collapse risk of the Nada Ward, Kobe City was calculated based on the method of Tokyo Metropolitan Government (TMG) using building inventory and soil condition data. The evaluated building collapse risk was compared with the actual building damage due to the 1995 Kobe Earthquake. Since the number of buildings in unit area is a dominant factor to determine the building collapse risk by the TMG method, the evaluated risk was high for densely built-up areas and it was not very good agreement with the actual damage distribution. Considering the result of comparison, a revised method, which divides the evaluated amount of risk by the total number of buildings in an area (removing the effect of building density in an area), was proposed. Besides we adopted the basic reliability analysis theory to calculate the weights.
The physical meaning of building collapse risk was interpreted properly by the proposed approach and it is generally applicable to entire Japan. Assessment of building collapse risk in urban areas is one of the important factors to be considered in urban planning. Hence the proposed method may be conveniently used by local governments in Japan for the seismic risk assessment of district level.
References
Abstract:
“The Earthquake Area Vulnerability Assessment of Tokyo”, which was published by Tokyo Metropolitan Government (TMG) recently, shows relative seismic risks in Tokyo. “The area danger levels” were determined with respect to building collapse, fire outbreak and spread, human casualties and access for evacuation, considering soil conditions, building inventory and social conditions. The method on the report was applied to Nada Ward, Kobe City using the inventory before the 1995 Hyogoken-Nanbu (Kobe) Earthquake. The obtained “building collapse risk” was compared with the actual damage of the ward due to the earthquake. The result of the comparison indicated that the weights used in the TMG method should be adjusted since the obtained collapse risk was strongly influenced by the building density of each city block. Then a revised method to evaluate “building collapse risk” was proposed. The new building collapse risk corresponds to the severe damage ratio of buildings and it reflects the characteristics of buildings and sites. The proposed method may be useful for seismic risk assessments by local governments in Japan.
1. Introduction
Since the 1995 Hyogoken-Nanbu Earthquake, many local and national governments of Japan have been more respected the studies of earthquake damage assessment. An earthquake causes fires, liquefaction, land slides and lifeline interruptions as well as damage to buildings and infrastructures. It is very important for local governments, not only of prefectures but also of cities or wards, to grasp seismic vulnerability of each city block. Recent GIS technologies enable us to assess seismic risk and to predict earthquake damage visually considering several kinds of inventories and other natural and social data.
This study deal with building collapse risk in “The Earthquake Area Vulnerability Assessment of Tokyo” [TMG, 1998]. This assessment is different from damage assessments for scenario earthquakes [TMG, 1997] in these points: (1) The former assumes no specific earthquake source model. (2) Rather simple model is used in the former.
In this study, in order to examine the assessment method of building collapse risk due to earthquakes, the method used in the TMG’s report was applied to the Nada Ward, Kobe City using building inventory before the 1995 Kobe Earthquake. The obtained “building collapse risk” was compared with the actual damage of the ward due to the earthquake and a revised method to estimate “building collapse risk” which fits the actual damage was proposed.
2. Application of the TMG Method to Nada Ward
2. 1 Building Collapse Risk by the Method of TMG
The building collapse risk by the method classified all the district blocks in Tokyo into five levels due to the amount of risk calculated with weights for building characteristics and site characteristics. These elements are determined by experiences of six professionals considering seismic vulnerability of buildings. The amount of risk (simply call "risk" hereafter) for building collapse was calculated by the following equations (1) and (2):
Qkn = Dk (1-Wkn·Ukn) (1)
Uk n= u1 n·u2 n·u3 n·u4 n·u 5 n (2)
in which k is the building category (1-19), Q is the amount of risk, D is the number of buildings per 1 km2 , W is the weight for earthquake resistant capacity of buildings of the category k, U is the weight for site characteristics, ui's are the weights for subsurface condition (u1), for possibility of liquefaction (u2), for large-scale cut-and-fill (u3), for reclaimed land (u4), and for steep slope (u5), n is each value by the 6 specialists. By adding Qk’s for all the structural types in a block, the amount of risk for the block is evaluated.
2. 2 Comparison between Building Collapse Risk and Actual
The building collapse risk of the Nada Ward in Kobe City was calculated using the inventory and soil data by the method of TMG. Soil conditions of each district block in Nada Ward were classified within TMG’s classification in choosing similar conditions in order to use the weights. As a result, the building collapse risk was determined as shown in Figure 1(a). Figure 1(b) shows the ratio of severely damaged buildings due to the 1995 Kobe Earthquake investigated by Kobe City. It is noticed that the distribution of building collapse risk evaluated by the method of TMG (Figure 1(a)) and the density of buildings (Figure 1(c)) look quite similar. It is observed that these two factors, the building collapse risk and the actual severe damage ratio, are not highly related. Although the former is strongly influenced by the building density of each district block. “The collapse of a building” itself is usually not influenced by the density of buildings in an area. Hence a revised amount of risk, which divides the evaluated amount of risk (by TMG method) by the total number of buildings in the block, is proposed.
(a) Building collapse risk by the method of TMG
(b) Severe damage ratio of buildings due to the Kobe Earthquake
(c) Number of buildings
Figure 1: Building collapse risk and actual damage in Nada Ward
3. New Evaluation Method of Building Collapse Risk Compatible with Actual Damage Ratio
3. 1 Modifications to the Method of TMG
The above-mentioned study indicated the way to modify “building collapse risk” as an index that reproduces the actual severe damage ratio of buildings in Nada Ward due to the Kobe Earthquake. First, in equation (1), " Dk: the number of buildings per 1 km 2 " is replaced by "Nk: the ratio of buildings with category k in number". By this, the building collapse risk which reproduces the severe damage ratio can be obtained. Next, the weights used in equation (1) were examined. In the method of TMG, the weights for the seismic resistance of buildings and the site condition are simply multiplied when evaluating the collapse risk. However, the collapse risk may be affected by the both parameters at the same time. Hence matrix-type weights should be introduced to consider the joint effect of the building resistance and the site condition (intensity of strong motion) on the collapse risk.
3. 2 Method of New Building Collapse Risk Evaluation
A new building collapse risk evaluation method is proposed in this study. In the proposed method, "Pi: the building collapse risk" is defined in the following equation as an index instead of "the amount of risk" in the method of TMG.
in which k is the building category (1-14), l indicates the subsurface soil condition (1-4), Nk is the ratio of buildings with category k in number, Wkl is the matrix-type weight for building category k and soil condition l. Classifying the collapse risk into 5 levels, a risk level of each block is obtained. By this equation (3), the effect of the building density is removed from the collapse risk evaluation, and more realistic risk that represents the building characteristics and site condition of an area can be calculated.
3. 3 Reliability Analysis to Obtain Damage Probability
In order to make the proposed method applicable to other areas in Japan, the matrix-type weights were determined by the basic reliability analysis theory. The vulnerability functions (fragility curves) of 14 building categories for severely damaged buildings developed by Murao and Yamazaki (2000) were used as the resistance of buildings. The values of the two parameters of the log-normal distributions are listed in Table 1.
Figure 2: Probability density function of the estimated PGV in the 1995 Kobe Earthquake for different topographical conditions in Nada Ward
Figure 2 shows the probability density functions of the estimated PGV in the Kobe Earthquake for different topographical conditions in Nada Ward. These functions were also obtained by a statistical analysis of the estimated PGV values in Nada Ward and the values of their parameters are shown in Table 1. The PGV value is widely distributed for mountain and alluvial fan while the range is comparatively narrower for terrace and delta. But, of course, this observation is the case for Nada Ward in the Kobe Earthquake. It is necessary to assume these functions when applying to other areas.
Using the basic reliability analysis theory, the probability for severe damage Pf,which is the function of the matrix-type weights, is obtained by the following equation:
in which R is the seismic resistance of buildings, S is the strong motion index (e.g. PGV), Fis the cumulative probability of the standard normal distribution, lz= lr - ls, and xz = ( xr2 + xs2 ) 1/2 , assuming independence between R and S. Using this equation, the weights for the building collapse risk can be calculated and the values are shown in Table 1. Figure 3(a) plots the comparison of the weights for the building collapse risk evaluated by equation (4) and the severe damage ratio observed in the Kobe Earthquake. It is seen that the obtained weights are compatible with the actual severe damage ratio. The building collapse risk of Nada Ward calculated by this method is plotted in Figure 3(b). Comparing this figure with the distribution of severe damage ratio in Figure 1(b), they look quite similar. Thus, it is conducted that the severe damage ratio was almost reproduced by the proposed method.
| lr | xr | Mountain | Terrace | Alluvial Fan | Delta | |||
| - | - | 1 | 2 | 3 | 4 | |||
| ls | - | - | - | 3.90 | 3.95 | 4.76 | 4.74 | |
| xs | - | - | - | 0.53 | 0.24 | 0.33 | 0.15 | |
| Wooden | -1951 | 1 | 4.36 | 0.41 | 24.6 | 19.5 | 77.9 | 80.8 |
| 1952-61 | 2 | 4.44 | 0.35 | 19.8 | 12.6 | 74.8 | 78.3 | |
| 1962-71 | 3 | 4.45 | 0.34 | 19.1 | 11.6 | 74.6 | 78.2 | |
| 1972-81 | 4 | 4.73 | 0.38 | 10.1 | 4.1 | 52.7 | 51.0 | |
| 1982-94 | 5 | 5.12 | 0.50 | 4.6 | 1.7 | 27.5 | 23.1 | |
| RC | -1971 | 6 | 5.12 | 0.65 | 7.1 | 4.4 | 31.0 | 28.2 |
| 1972-81 | 7 | 5.33 | 0.58 | 3.4 | 1.3 | 19.7 | 16.1 | |
| 1982-94 | 8 | 6.01 | 0.79 | 1.3 | 0.6 | 7.3 | 5.8 | |
| Steel Frame | -1971 | 9 | 4.64 | 0.62 | 18.2 | 15.0 | 57.0 | 56.2 |
| 1972-81 | 10 | 4.97 | 0.49 | 6.8 | 3.0 | 36.1 | 32.4 | |
| 1982-94 | 11 | 5.64 | 0.73 | 2.7 | 1.4 | 13.7 | 11.3 | |
| Light Gauge Steel Frame | -1971 | 12 | 4.70 | 0.55 | 14.8 | 10.7 | 54.2 | 53.1 |
| 1972-81 | 13 | 5.82 | 0.97 | 4.1 | 3.1 | 15.2 | 13.6 | |
| 1982-94 | 14 | 6.19 | 1.10 | 3.1 | 2.4 | 10.8 | 9.7 | |
(a)
(b)
Figure 3: (a) Comparison between the actual severe damage ratio and the evaluated severe damage probability; (b) The proposed building collapse risk of Nada Ward
3. 4 New Building Collapse Risk of Tokyo
Reapplying the method proposed above to Tokyo, the building collapse risk in Tokyo was evaluated. In calculating the new building collapse risk, the median of PGV in mountain areas was assumed to be 30cm/s, which was used in the damage assessment study of TMG (1997) for near-field earthquakes. The median values of PGV in other topographical conditions were obtained by multiplying the amplification factors proposed by Yamazaki et al. (1999). The logarithmic standard deviation of PGV was assumed as the record-to-record (intra-event) variation in the attenuation relation of PGV proposed by Molas and Yamazaki (1995).
Under these assumptions, the new building collapse risk of Tokyo was calculated and it was compared with that by TMG as shown in Figure 4. It is seen in the figure that the risk level in the eastern part of Tokyo (lowland with soft soil) is large by the proposed method while the high-risk blocks are distributed outside of Yamanote Line circle (highly built-up wooden building areas) by the TMG method. Soil condition and building type are dominant factors to determine the collapse risk in the proposed method. However, since the Urban Planning Bureau of TMG uses this building collapse risk in the selection of areas for urban redevelopment, the risk by the TMG method may have different meaning from the risk evaluated by the proposed method.
(a) Building collapse risk by TMG (1998)
(b) Building collapse risk by the proposed method
Figure 4: Comparison of building collapse risk in Tokyo by two methods
4. Conclusions
In this study, the building collapse risk of the Nada Ward, Kobe City was calculated based on the method of Tokyo Metropolitan Government (TMG) using building inventory and soil condition data. The evaluated building collapse risk was compared with the actual building damage due to the 1995 Kobe Earthquake. Since the number of buildings in unit area is a dominant factor to determine the building collapse risk by the TMG method, the evaluated risk was high for densely built-up areas and it was not very good agreement with the actual damage distribution. Considering the result of comparison, a revised method, which divides the evaluated amount of risk by the total number of buildings in an area (removing the effect of building density in an area), was proposed. Besides we adopted the basic reliability analysis theory to calculate the weights.
The physical meaning of building collapse risk was interpreted properly by the proposed approach and it is generally applicable to entire Japan. Assessment of building collapse risk in urban areas is one of the important factors to be considered in urban planning. Hence the proposed method may be conveniently used by local governments in Japan for the seismic risk assessment of district level.
References
- Molas, G. L., Yamazaki, F. (1995), “Attenuation of Earthquake Ground Motion in Japan Including Deep Focus Events,” Bulletin of the Seismological Society of America, 85, 5, pp. 1343-1358.
- Murao, O., and Yamazaki, F. (1999), “Re-estimation of Strong Ground Motion in Nada Ward based on Inventory and Building Damage Data”, Journal of Structural and Construction Engineering, AIJ, 523, pp. 141.148 (in Japanese).
- Murao, O., and Yamazaki, F. (2000), “Development of Fragility Curves for Buildings Based on Damage Survey Data of a Local Government after the 1995 Hyogoken-Nanbu Earthquake”, Journal of Structural and Construction Engineering, AIJ, 527 (in Japanese), (in printing).
- Tokyo Metropolitan Government (1997), The Report on the Damage Assessments for Scenario Earthquakes in Tokyo due to Near-field Earthquakes (in Japanese). Tokyo Metropolitan Government (1998), The Fourth Report of Survey of the Earthquake Area Vulnerability Assessment (in Japanese).
- Yamazaki, F., Wakamatsu, K., Onishi, J., and Yamauchi, H. (1999), “Relationship between Geomorphological Land Classification and Soil Amplification Ratio Based on JMA Strong Motion Records”, Bulletin of Earthquake Resistant Structure Research Center, No. 32, Institute of Industrial Science, The University of Tokyo, pp. 17-33.