| GISdevelopment.net ---> AARS ---> ACRS 1999 ---> Poster Session 2 |
Integrated use of backscatter
and coherence imagery on C and L band for identification of land cover in
tropics
- A case study in Southern Sumatra, Indonesia -
- A case study in Southern Sumatra, Indonesia -
Masayasu Maki
Graduate School
Faculty of Agriculture, Utsunomiya University
350 Mine-machi, Utsunomiya, Tochigi 321-8505, Japan
Mikiyasu Nakayama
United Graduate School of Agricultural Science
Tokyo University of Agriculture and Technology
3-5-8 Saiwai-cho, Fuchuu-city, Tokyo 183-8509, Japan
Graduate School
Faculty of Agriculture, Utsunomiya University
350 Mine-machi, Utsunomiya, Tochigi 321-8505, Japan
Mikiyasu Nakayama
United Graduate School of Agricultural Science
Tokyo University of Agriculture and Technology
3-5-8 Saiwai-cho, Fuchuu-city, Tokyo 183-8509, Japan
Keywords:Backscatter, Classification, Coherence,
Land cover, SAR
Abstract:
In Indonesia, tropical rain forest is one of the major natural resource covering 60% of the total area. Much of the rain forests have been destroyed, while the rate of deforestation is not well known in many regions. It is therefore necessary to observe land cover frequently to monitor the rate of the changes. In a region under frequent cloud cover, like Indonesia, it is hard to obtain cloud-free images by optical band sensors. The authors tried to monitor the land cover by JERS-1 and ERS-1/-2 SAR data including both backscatter and coherence images. The study area is situated in Sumatra island, Indonesia, where five land cover categories (plantation type 1, plantation type 2, forest area, deforested area, and bare soil) exist. The methodologies used were as follow: 1) Evaluating the performance of backscatter and coherence images, obtained by each sensor, in identification of land cover. 2) Finding out the best combination of SAR sensors and images in land cover classification. Following results were obtained: 1) Only two broad categories (i.e. vegetated area and non-vegetated area) were satisfactorily identified with the backscatter image by ERS-1/-2, while four categories were classified by combining the backscatter image with the coherence image by ERS-1/-2. 2) Three to four categories were classified with the backscatter image by JERS-1 and adding coherence data failed to improve the accuracy of classification. 3) Four to five categories were classified by combining backscatter image of ERS-1/-2 with the same of JERS-1. For the purpose of assessing land cover, in the terms of operation, it is hard to obtain a coherence image, for ERS-1/-2 should be in tandem operator mode and finding a “good pair” of JERS-1 data is not always feasible. Combining backscatter image of ERS-1/-2 with the same of JERS-1 therefore seems the beat practical way to identify the land cover of the study area, for it does not require coherence images.
1. Background:
Use of coherence data from operational satellite based SAR sensors (e.g. on ERS-1/-2 or JERS-1), in addition to ordinary backscatter data, has been experimented both on C and L band to identify landcover in tropics (Ribbes et. al., 1999; Siegert and Nakayama, 1999).
While coherence data proved useful to improve accuracy in landcover identification, such data are not readily available. It is because ERS-1 and –2 should be in tandem operation mode to secure a pair of ERS SAR data suitable for interferometry in tropics (Stussi, et. al., 1996), and repeat-pass interferometry by JERS-1 SAR data is often not feasible due to a large distance between two orbits.
On the other hand, integrated use of backcatter data by multiple satellites is readily feasible. The very question to be asked is whether integration of backscatter data on multiple bands (e.g. C and L band) is either inferior or superior to use of coherence data. Most of previous researches, on use of coherence data for landcover identification in tropics, concentrated on use of data on single band. We therefore still do not have a solid clue to answer to the very question.
The aim of this study is to evaluate the performance of "integrated use" of backscatter data on C and L band (by ERS and JERS respectively) to identify landcover, vis-a-vis the same by combination of backscatter and coherence data by single satellite.
2. Methodology and Results:
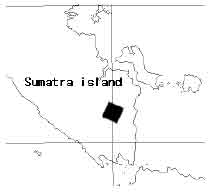
Figure 1: Study Area
The performance of SAR data in landcover identification was examined in the following five cases.
Case 1: Backscatter alone by ERS
Case 2: Backscatter and Coherence by ERS
Case 3: Backscatter alone by JERS
Case 4: Backscatter and Coherence by JERS
Case 5: Backscatter by both ERS and JERS
The study was carried out for an area in the southern part of the Sumatra island, Indonesia (see Figure 1). The area has been intensively converted from natural forest into plantation. As shown in the previous study for this area (Stussi, et. al., 1996), five categories of landcover (namely, forest, bare soil, deforested area, plantation type 1 and plantation type 2) exist in this study area.
For ERS-1 and –2, the outcome of the previous research (Stussi, et. al., 1996) was used as it was. Both backscatter and coherence data were obtained in June 1996, when ERS-1 and –2 were put into tandem operation mode. As shown in Figure 2, only two classes may be identified with the backscatter data alone, while four classes could be delineated by adding the coherence data.
For JERS-1, the backscatter data were obtained in June 1996. The coherence data were calculated out of a pair of SAR data secured in June and October 1996, with return period of 132 days. As shown in Figure 3, only three to four classes may be identified with the backscatter data alone and adding coherence data failed to improve the accuracy of classification.
Comparing figures 2 and 3, it sounds safe to assume that four to five classes may be identified by integrating backscatter data on two bands. It represents the best results among the five cases examined.
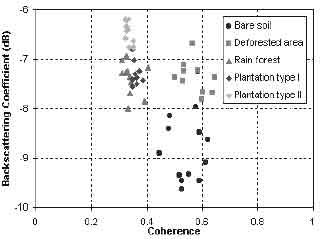
Figure 2: Landcover Classification by ERS-1/-2 data
[Source: Stussi, et. al., 1996]
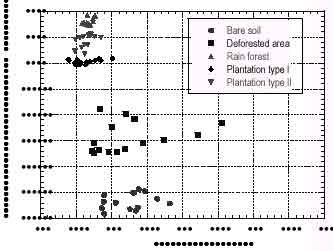
Figure 3: Landcover Classification by JERS-1 data
3.Conclusion:
The outcome of the study suggests:
Integrated use of backscatter data on two bands by ERS and JERS is as powerful as use of backscatter and coherence data on single band by one of these satellites.
In operational terms, difficult-to-obtain coherence data are not absolutely needed to identify landcover.
Repeat-pass interferometry is feasible on L band with JERS SAR data in Indonesia even with 132 days of return period, while repeat-pass interferometry is not employable on C band with ERS data in tropics.
4. Further studies:
Further studies need to be carried out. A caveat for this study is that the training areas on two bands are not necessarily identical. It was because only a graph (i.e. Figure 2) was available on C band, as the outcome of a previous study. A study is now on-going in collaboration with the National University of Singapore in order to carry out the same study but with identical training areas.
The initial outcome of this new study has let the author believe that the conclusion reached is robust, while it ought to be numerically verified.
References:
Abstract:
In Indonesia, tropical rain forest is one of the major natural resource covering 60% of the total area. Much of the rain forests have been destroyed, while the rate of deforestation is not well known in many regions. It is therefore necessary to observe land cover frequently to monitor the rate of the changes. In a region under frequent cloud cover, like Indonesia, it is hard to obtain cloud-free images by optical band sensors. The authors tried to monitor the land cover by JERS-1 and ERS-1/-2 SAR data including both backscatter and coherence images. The study area is situated in Sumatra island, Indonesia, where five land cover categories (plantation type 1, plantation type 2, forest area, deforested area, and bare soil) exist. The methodologies used were as follow: 1) Evaluating the performance of backscatter and coherence images, obtained by each sensor, in identification of land cover. 2) Finding out the best combination of SAR sensors and images in land cover classification. Following results were obtained: 1) Only two broad categories (i.e. vegetated area and non-vegetated area) were satisfactorily identified with the backscatter image by ERS-1/-2, while four categories were classified by combining the backscatter image with the coherence image by ERS-1/-2. 2) Three to four categories were classified with the backscatter image by JERS-1 and adding coherence data failed to improve the accuracy of classification. 3) Four to five categories were classified by combining backscatter image of ERS-1/-2 with the same of JERS-1. For the purpose of assessing land cover, in the terms of operation, it is hard to obtain a coherence image, for ERS-1/-2 should be in tandem operator mode and finding a “good pair” of JERS-1 data is not always feasible. Combining backscatter image of ERS-1/-2 with the same of JERS-1 therefore seems the beat practical way to identify the land cover of the study area, for it does not require coherence images.
1. Background:
Use of coherence data from operational satellite based SAR sensors (e.g. on ERS-1/-2 or JERS-1), in addition to ordinary backscatter data, has been experimented both on C and L band to identify landcover in tropics (Ribbes et. al., 1999; Siegert and Nakayama, 1999).
While coherence data proved useful to improve accuracy in landcover identification, such data are not readily available. It is because ERS-1 and –2 should be in tandem operation mode to secure a pair of ERS SAR data suitable for interferometry in tropics (Stussi, et. al., 1996), and repeat-pass interferometry by JERS-1 SAR data is often not feasible due to a large distance between two orbits.
On the other hand, integrated use of backcatter data by multiple satellites is readily feasible. The very question to be asked is whether integration of backscatter data on multiple bands (e.g. C and L band) is either inferior or superior to use of coherence data. Most of previous researches, on use of coherence data for landcover identification in tropics, concentrated on use of data on single band. We therefore still do not have a solid clue to answer to the very question.
The aim of this study is to evaluate the performance of "integrated use" of backscatter data on C and L band (by ERS and JERS respectively) to identify landcover, vis-a-vis the same by combination of backscatter and coherence data by single satellite.
2. Methodology and Results:
Figure 1: Study Area
The performance of SAR data in landcover identification was examined in the following five cases.
Case 1: Backscatter alone by ERS
Case 2: Backscatter and Coherence by ERS
Case 3: Backscatter alone by JERS
Case 4: Backscatter and Coherence by JERS
Case 5: Backscatter by both ERS and JERS
The study was carried out for an area in the southern part of the Sumatra island, Indonesia (see Figure 1). The area has been intensively converted from natural forest into plantation. As shown in the previous study for this area (Stussi, et. al., 1996), five categories of landcover (namely, forest, bare soil, deforested area, plantation type 1 and plantation type 2) exist in this study area.
For ERS-1 and –2, the outcome of the previous research (Stussi, et. al., 1996) was used as it was. Both backscatter and coherence data were obtained in June 1996, when ERS-1 and –2 were put into tandem operation mode. As shown in Figure 2, only two classes may be identified with the backscatter data alone, while four classes could be delineated by adding the coherence data.
For JERS-1, the backscatter data were obtained in June 1996. The coherence data were calculated out of a pair of SAR data secured in June and October 1996, with return period of 132 days. As shown in Figure 3, only three to four classes may be identified with the backscatter data alone and adding coherence data failed to improve the accuracy of classification.
Comparing figures 2 and 3, it sounds safe to assume that four to five classes may be identified by integrating backscatter data on two bands. It represents the best results among the five cases examined.
Figure 2: Landcover Classification by ERS-1/-2 data
[Source: Stussi, et. al., 1996]
Figure 3: Landcover Classification by JERS-1 data
3.Conclusion:
The outcome of the study suggests:
Integrated use of backscatter data on two bands by ERS and JERS is as powerful as use of backscatter and coherence data on single band by one of these satellites.
In operational terms, difficult-to-obtain coherence data are not absolutely needed to identify landcover.
Repeat-pass interferometry is feasible on L band with JERS SAR data in Indonesia even with 132 days of return period, while repeat-pass interferometry is not employable on C band with ERS data in tropics.
4. Further studies:
Further studies need to be carried out. A caveat for this study is that the training areas on two bands are not necessarily identical. It was because only a graph (i.e. Figure 2) was available on C band, as the outcome of a previous study. A study is now on-going in collaboration with the National University of Singapore in order to carry out the same study but with identical training areas.
The initial outcome of this new study has let the author believe that the conclusion reached is robust, while it ought to be numerically verified.
References:
- Ribbes, F., Le Toan. T., Floury, N., Wasrin, U.R. (1999): Deforestation Monitoring in Tropical Regions using Multitemporal ERS/JERS SAR and InSAR Data, JERS-1 Science Program '99 PI Reports, NASDA, Tokyo.
- Siegert, F. and Nakayama.M. (1999): Comparison of ERS and JERS SAR data to assess the fire disaster in Kalimantan 1997/1998, ESA/NASDA Workshop on Disaster Management, Unispace III, 22 July 1999, Vienna.
- Stussi, N., Kwoh, L.K., Liew, S.C., Singh, K., Lim, H. (1996): ERS-1/2 Interferometry: Some Results on Tropical Forest, ESA Workshop on Applications of ERS SAR Interferometry, 30 September to 2 October 1996, Zurich.