| GISdevelopment.net ---> AARS ---> ACRS 1999 ---> Poster Session 2 |
Generating Water Resource
Distribution Map using R.S. and GIS at Global Scale
Kiyoo Kamiyama*, Shiro
Ochi*, and Ryosuke Shibasaki*
Center for Spatial Information Science and Institute of Industrial Science
University of Tokyo
4-6-1, Komaba, Meguro-ku, Tokyo, 106-8505, Japan
Tel : +81-3-5452-6417 Fax: +81-3-5452-6417
http://www.gisdevelopment.net/aars/acrs/1999/ps2/kamiyama@skl.iis.u-tokyo.ac.jp
Center for Spatial Information Science and Institute of Industrial Science
University of Tokyo
4-6-1, Komaba, Meguro-ku, Tokyo, 106-8505, Japan
Tel : +81-3-5452-6417 Fax: +81-3-5452-6417
http://www.gisdevelopment.net/aars/acrs/1999/ps2/kamiyama@skl.iis.u-tokyo.ac.jp
Keyword: Water Balance Model, Discharge Map,
Water Resource Distribution Map
Abstract
In 21th century, food problem may become much more serious due to the increasing world population. The number of nations importing grains continues to grow steadily. Since water resource is done of the most important limiting factor, quantitative analysis of available water resource is necessary to evaluate the potential growth of agricultural productivity that is enhanced by irrigation system. A hydrological model based on "Water Balance Model" is proposed in this paper to simulate monthly water resource distribution at global scale using Remote Sensing data and GIS. Water Resource Distribution Map is being generated by means of hydrological model. The result has been verified using runoff data of great rivers of Asia. Global map of water resource may help in planning of irrigation system in order to enhance the agricultural productivity as well as food demand of increasing world population.
1.Background and Purpose
Demand for water is growing rapidly as populations and industrial activities expand and irrigated agriculture continues to increase. World Resources Institute reports that from 1940 to 1990, withdrawals of freshwater from rivers, lakes, underground aquifers increased. Many current patterns of water withdrawals are clearly unsustainable, such as pumping from subsoil aquifers at rates far greater than they are recharged. Freshwater habitats are threatened by water shortages, which are already critical in some regions. And it is posing obstacles to sustainable development of human society itself.
The future availability of water for human use depends on how water resources are managed. Especially, in water-shortage regions, pressures on management of water resources will become more important. According to estimate by World Resources Institute, 1 billion to 2.4 billion people (13 to 20 percent of the projected world population) will live in water-scarce countries by 2050. Africa and some countries in the western Asia appear particularly vulnerable in the population explosion. Therefore, water resources map at a global scale is strongly required to support the improvement of water use efficiency, avoiding wasteful water use, preserving supplies and planning irrigation system.
In this research, firstly the authors produced “Discharge Map” using a hydrological model based on "Water Balance Model" and “DDM(Drainage Direction Matrix)”. Next, authors proposed a model for estimating water resources on the basis of “Discharge Map”, then, examined the reliability of the model and finally produced “Water Resource Distribution Map”. Figure 2-1 shows flowchart of this research.
Figure 2-1 Flowchart of This Research
2.Data set
Table 2-1 shows data sets used in this research.
Table2-1 Data Set in this research
3.Generating Discharge Map
3-1 Water Balance Model
The authors used Water Balance Model developed by An&Tateishi(1995). Figure 3-1 shows computing scheme of grid-based Water Balance Model. Water surplus and deficit corresponds to the positive or negative value of the difference between precipitation and potential evapotranspiration. Water surplus and deficit are estimated for each grid cell. Figure 3-2 shows flowchart of the computation.
Figure 3-1 water balance model reference) An and Tateishi (1995)
Figure 3-2 Computation of water surplus and water deficit reference) An and Tateishi (1995)
3-2 Producing DDM (Drainage Direction Matrices) For ground elevation data and drainage network data, GTOPO30 and DCW (Digital Chart of World) are used respectively. The authors applied the algorithm by Ochi S. (1999) to produced DDM.
At the grid cells whose slope gradient is more than 1 degree, water run down to one of the neighboring grid cell, which has the lowest elevation value. Especially at the flat grid cells whose slope gradient is less than 1 degree, DCW rather than GTOPO30 is used in determining to avoid endless loop of the runoff direction. Direction value such as figure 3-3 is given in each grid cells.
Figure 3.3 Definition of directions
Step 1:
In deciding the direction of runoff on a river, a target is set to be a grid cell on a river and a goal is set to be a grid cell on sea. Figure 3-4 shows relationship of the target and goal.
1) The grid cell downstream of the target cell is searched by the DDM.
2) The target is shifted to the connected one. The above procedure is repeated until the target reaches the goal cell. If the target cell can’t reach the goal cell, DDM on the stuck grid cell is modified so that the target cell can reach the sea.
Figure 3.4 Step 1 of producing DDM
Step 2:
In deciding the direction of runoff on slope, a target is set to be a grid cell on slant and a goal is set to be a grid cell on sea and river. Figure 3-5 shows relationship of the target and goal.
1) The grid cell downstream of the target cell is searched among grid cells adjoining to the target by the DDM.
2) The target is shifted to the connected one.
Figure 3.5 Step 2 of producing DDM
The above procedure is repeated until the target cell reaches the sea and river.
As a result, all grid cells on land territory run down either to sea along DDM.
3-3 Generating Discharge Map
As figure 3-3 shows, DDM has numerical value of 1 byte(unsigned char) in each grid cell. On a river, 2,4,6, and 8 is given by the DDM. On the other grid cells, value from 1 to 9 is given by the DDM. Value “0” is given to sea territory, and value “5” is given to grid cells on slope which have no direction of runoff. Discharge Map can be generated using value of water balance and value of the DDM. Figure 3-6 shows an example of producing the Discharge Map.
1) Each grid cell of the water balance matrix is set to 1.
2) The current grid cell is set up as a source cell. Connected neighbor grid cell is found by means of the DDM.
3) The content of the source cell is added to the content of the connected neighbor grid cell.
4) If value of DDM is “0” or “5”, this calculation is finished.
When this procedure is repeated on all grid cells, discharge map is generated. For example, figure 3-7 shows discharge map in Asia.
Figure 3-6 Example of producing discharge map
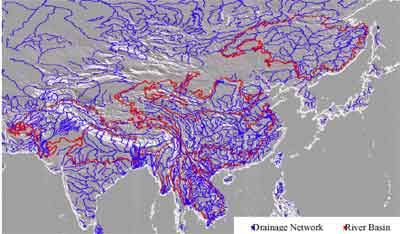
Figure 3-7 Discharge Map in Asia
3-4 Verification of Discharge Map
The authors verified the discharge map, by comparing the simulation output with the observation data on several points by GRDC. This intimate verification is going on. This result of comparison will prove that the simulation is almost accurate. But we will be able to derive better result from improving the water balance model.
4. Generating water resource distribution map
4-1:Definition of water resource distribution map
The water resource distribution map shows the amount of available water at each grid cell, assuming that water can be pumped from the neighboring river. The available water on a grid cell is estimated, using the elevation difference and the distance between the closest river and an object-grid-cell. As shown in figure 4-1, the distance is defined along the route through which the water flowed down.
Figure 4-1 Elevation difference and distance of runoff route
4-2:Estimation of the available water The authors apply “potential energy” concept in order to take the elevation difference into account. And it is assumed the available water is in inverse proportion to the distance in order to take the distance into account.
4-3:Generating water resource distribution map
Drainage network whose discharge is more than “D” is extracted from the discharge map in chapter 3. Constant “D” is determined for each river from the annual least discharge. If the runoff on a grid cell runs down along DDM and reaches the drainage network like figure 4-1, the elevation difference and the distance are calculated for each grid cell. When the workload is given as constant “W”, the formula for finding the available water is:

AW[ m3/y]: available water, W[ KWy]: workload, g[ m/s2 ]: acceleration of gravity, E[ m]: elevation difference, d[ m]: distance from the drainage network.
We can calculate the available water on all grid cells by the above-mentioned formula. For example, water resource distribution map of Mekong basin is shown at figure 4-2.
Figure 4-2 Water Resource Distribution Map on Mekong Basin
5. Conclusions and Future works
5-1:Conclusions
We generated Discharge Map using water balance model and DDM. But water balance model has several problems. At first, the estimation of evapotranspiration is overestimated in winter because water balance model takes the snowfall as the rainfall. Secondly, the estimation of runoff is not very accurate because the model doesn’t separate groundwater runoff from surface runoff.
We generated Water Resource Distribution Map using Discharge map. But this output has problems. The author does not take reservoirs and dams into account in calculating the available water. If reservoirs and dams are taken into account, water resource distribution map will become a more accurate. The improved result may help in planning of irrigation system in order to enhance the agricultural productivity as well as food demand of increasing world population.
5-2:Future work
Demand for water can be estimated using population and agricultural productivity at each grid cell. Comparing the demand for water with the available water, we are able to evaluate whether each river can meet the demand or not.
6. References
Abstract
In 21th century, food problem may become much more serious due to the increasing world population. The number of nations importing grains continues to grow steadily. Since water resource is done of the most important limiting factor, quantitative analysis of available water resource is necessary to evaluate the potential growth of agricultural productivity that is enhanced by irrigation system. A hydrological model based on "Water Balance Model" is proposed in this paper to simulate monthly water resource distribution at global scale using Remote Sensing data and GIS. Water Resource Distribution Map is being generated by means of hydrological model. The result has been verified using runoff data of great rivers of Asia. Global map of water resource may help in planning of irrigation system in order to enhance the agricultural productivity as well as food demand of increasing world population.
1.Background and Purpose
Demand for water is growing rapidly as populations and industrial activities expand and irrigated agriculture continues to increase. World Resources Institute reports that from 1940 to 1990, withdrawals of freshwater from rivers, lakes, underground aquifers increased. Many current patterns of water withdrawals are clearly unsustainable, such as pumping from subsoil aquifers at rates far greater than they are recharged. Freshwater habitats are threatened by water shortages, which are already critical in some regions. And it is posing obstacles to sustainable development of human society itself.
The future availability of water for human use depends on how water resources are managed. Especially, in water-shortage regions, pressures on management of water resources will become more important. According to estimate by World Resources Institute, 1 billion to 2.4 billion people (13 to 20 percent of the projected world population) will live in water-scarce countries by 2050. Africa and some countries in the western Asia appear particularly vulnerable in the population explosion. Therefore, water resources map at a global scale is strongly required to support the improvement of water use efficiency, avoiding wasteful water use, preserving supplies and planning irrigation system.
In this research, firstly the authors produced “Discharge Map” using a hydrological model based on "Water Balance Model" and “DDM(Drainage Direction Matrix)”. Next, authors proposed a model for estimating water resources on the basis of “Discharge Map”, then, examined the reliability of the model and finally produced “Water Resource Distribution Map”. Figure 2-1 shows flowchart of this research.
Figure 2-1 Flowchart of This Research
2.Data set
Table 2-1 shows data sets used in this research.
| Variable | Content description | Source | Form | Resolution |
| Annual Water balance | water balance (mm/y) | Chiba University | raster | 30 minutes |
| GTOPO30 | DEM on global scale (m) | U.S.Geological SurveyEROS Data Center | raster | 30 seconds |
| DCW (Digital Chart of World) | Drainage Network | ESRI Incorporation Global Coverage GIS Database | vector | - |
3.Generating Discharge Map
3-1 Water Balance Model
The authors used Water Balance Model developed by An&Tateishi(1995). Figure 3-1 shows computing scheme of grid-based Water Balance Model. Water surplus and deficit corresponds to the positive or negative value of the difference between precipitation and potential evapotranspiration. Water surplus and deficit are estimated for each grid cell. Figure 3-2 shows flowchart of the computation.
Figure 3-1 water balance model reference) An and Tateishi (1995)
Figure 3-2 Computation of water surplus and water deficit reference) An and Tateishi (1995)
3-2 Producing DDM (Drainage Direction Matrices) For ground elevation data and drainage network data, GTOPO30 and DCW (Digital Chart of World) are used respectively. The authors applied the algorithm by Ochi S. (1999) to produced DDM.
At the grid cells whose slope gradient is more than 1 degree, water run down to one of the neighboring grid cell, which has the lowest elevation value. Especially at the flat grid cells whose slope gradient is less than 1 degree, DCW rather than GTOPO30 is used in determining to avoid endless loop of the runoff direction. Direction value such as figure 3-3 is given in each grid cells.
Figure 3.3 Definition of directions
Step 1:
In deciding the direction of runoff on a river, a target is set to be a grid cell on a river and a goal is set to be a grid cell on sea. Figure 3-4 shows relationship of the target and goal.
1) The grid cell downstream of the target cell is searched by the DDM.
2) The target is shifted to the connected one. The above procedure is repeated until the target reaches the goal cell. If the target cell can’t reach the goal cell, DDM on the stuck grid cell is modified so that the target cell can reach the sea.
Figure 3.4 Step 1 of producing DDM
Step 2:
In deciding the direction of runoff on slope, a target is set to be a grid cell on slant and a goal is set to be a grid cell on sea and river. Figure 3-5 shows relationship of the target and goal.
1) The grid cell downstream of the target cell is searched among grid cells adjoining to the target by the DDM.
2) The target is shifted to the connected one.
Figure 3.5 Step 2 of producing DDM
The above procedure is repeated until the target cell reaches the sea and river.
As a result, all grid cells on land territory run down either to sea along DDM.
3-3 Generating Discharge Map
As figure 3-3 shows, DDM has numerical value of 1 byte(unsigned char) in each grid cell. On a river, 2,4,6, and 8 is given by the DDM. On the other grid cells, value from 1 to 9 is given by the DDM. Value “0” is given to sea territory, and value “5” is given to grid cells on slope which have no direction of runoff. Discharge Map can be generated using value of water balance and value of the DDM. Figure 3-6 shows an example of producing the Discharge Map.
1) Each grid cell of the water balance matrix is set to 1.
2) The current grid cell is set up as a source cell. Connected neighbor grid cell is found by means of the DDM.
3) The content of the source cell is added to the content of the connected neighbor grid cell.
4) If value of DDM is “0” or “5”, this calculation is finished.
When this procedure is repeated on all grid cells, discharge map is generated. For example, figure 3-7 shows discharge map in Asia.
| Water Balance Matrix | Direction Matrix | Discharge Matrix |
 | ||
Figure 3-6 Example of producing discharge map
Figure 3-7 Discharge Map in Asia
3-4 Verification of Discharge Map
The authors verified the discharge map, by comparing the simulation output with the observation data on several points by GRDC. This intimate verification is going on. This result of comparison will prove that the simulation is almost accurate. But we will be able to derive better result from improving the water balance model.
4. Generating water resource distribution map
4-1:Definition of water resource distribution map
The water resource distribution map shows the amount of available water at each grid cell, assuming that water can be pumped from the neighboring river. The available water on a grid cell is estimated, using the elevation difference and the distance between the closest river and an object-grid-cell. As shown in figure 4-1, the distance is defined along the route through which the water flowed down.
Figure 4-1 Elevation difference and distance of runoff route
4-2:Estimation of the available water The authors apply “potential energy” concept in order to take the elevation difference into account. And it is assumed the available water is in inverse proportion to the distance in order to take the distance into account.
4-3:Generating water resource distribution map
Drainage network whose discharge is more than “D” is extracted from the discharge map in chapter 3. Constant “D” is determined for each river from the annual least discharge. If the runoff on a grid cell runs down along DDM and reaches the drainage network like figure 4-1, the elevation difference and the distance are calculated for each grid cell. When the workload is given as constant “W”, the formula for finding the available water is:
AW[ m3/y]: available water, W[ KWy]: workload, g[ m/s2 ]: acceleration of gravity, E[ m]: elevation difference, d[ m]: distance from the drainage network.
We can calculate the available water on all grid cells by the above-mentioned formula. For example, water resource distribution map of Mekong basin is shown at figure 4-2.
Figure 4-2 Water Resource Distribution Map on Mekong Basin
5. Conclusions and Future works
5-1:Conclusions
We generated Discharge Map using water balance model and DDM. But water balance model has several problems. At first, the estimation of evapotranspiration is overestimated in winter because water balance model takes the snowfall as the rainfall. Secondly, the estimation of runoff is not very accurate because the model doesn’t separate groundwater runoff from surface runoff.
We generated Water Resource Distribution Map using Discharge map. But this output has problems. The author does not take reservoirs and dams into account in calculating the available water. If reservoirs and dams are taken into account, water resource distribution map will become a more accurate. The improved result may help in planning of irrigation system in order to enhance the agricultural productivity as well as food demand of increasing world population.
5-2:Future work
Demand for water can be estimated using population and agricultural productivity at each grid cell. Comparing the demand for water with the available water, we are able to evaluate whether each river can meet the demand or not.
6. References
- An and Tateishi (1995): Estimates of Global Land Evapotranspiration and Water Resources Using GIS Techniques
- Ochi S. (1999): Algorithm for Generating Drainage Direction Matrix using DEM(GTOPO30) and DCW, Photogrammetry and Remote Sensing ,Vol.38, No.3
- Nogami M. (1998); An Algorithm and a C-Program Source for Automated Drainage Network Extraction, Theory and Application of GIS, Vol. 6, No.1