| GISdevelopment.net ---> AARS ---> ACRS 1999 ---> Poster Session 2 |
Estimation of Grass Canopy
Height using its BRDF Property
Asako KONDA, Daisuke HONGO,
Hironori ICHIKAWA, Koji Kajiwara, Yoshiaki HONDA*1 , Masao
MORIYAMA *2
*1Center for Environmental Remote Sensing (CEReS), Chiba University
1-33, Yayoi, Inage-Ku Chiba 263, JAPAN
TEL:(81)-43-290-3945 FAX:(81)-43-290-3857
http://www.gisdevelopment.net/aars/acrs/1999/ps2/konda@ceres,cr,chiba-u.ac.jp
*1Center for Environmental Remote Sensing (CEReS), Chiba University
1-33, Yayoi, Inage-Ku Chiba 263, JAPAN
TEL:(81)-43-290-3945 FAX:(81)-43-290-3857
http://www.gisdevelopment.net/aars/acrs/1999/ps2/konda@ceres,cr,chiba-u.ac.jp
Abstract
When an analysis of physical quantity of vegetation using a satellite remote-sensing technology, it is very effective for monitoring of a global area. However, these satellite data include many errors by an atmosphere, a sun-target-sensor geometry, sensor characteristics and so on. BRDF (Bi-directional Reflectance Distribution Factor) is one of them. And almost researcher should not use that, and except that. We are understood that if we corect BRDF error for satellite data, we need some geometric information, LAI, and another information. We changed our thought. Using BRDF characteristics for satellite data analysis, we will possible to obtain some information for satellite data. This study is first step of using BRDF analysis for satellite.
1. Introduction
It is (1999, Yamamoto etc.) that is understanding that is estimated with a high correlation that the information of a height of grass is adopted, in the case that estimate biomass and calculate NDVI more the data of the spectrum reflection rate that was obtained with location observation. However, in the case that this is adapted to the satellite sensor the information of the height of grass is a present condition to be estimating biomass from only NDVI, without being proposed to estimate from the satellite.
The information etc. of the position information, the sun of the reflection rate, sensor of the reflection rate, soil of a/the height of grass, stock number, plain are being substituted, in the BRDF model that Watanabe etc. proposed in 1998. It is make the multidimensional simultaneous equations of the coefficient such as grass canopy height, stock numbers that can not estimate this model, from the satellite sensor such as grass canopy height, stock several, that I use several bands of the many channel sensors of GLI, MODIS etc.
2. Objectives
The main purposes of this study are as follows:
Ground truth
We measured BRDF using our original system (Fig. 2.1 and 2.2) in 1998 and 1999. The measurement areas were located in Mongolian grassland. The areas were homogeneity, and not influenced by geographical (Fig 2.3). In 1998, there was much rain, therefore vegetation condition was very good. And grasses had grown, while we were measuring. However, in 1999, there was few rain. And growth of grasses was not so good.
However, we were obtain data of deferent grass canopy height at same measurement area. And we compared with those data, and study relationship between BRDF and grass canopy height. Table 2.1 is obtained and using data for study relationship.
Table 2.1 List of using Field Data
4. Results
We did an analysis in accordance with the band of OCTS. In this section, the characteristic of BRDF by the difference of height of grass is shown(Fig3.1 ~ 3.3). Using analyzing data in this section is that I observed in, 17:00 on August 9, 1998 here and we are using the data that I observed in 16:00 on August 19, 1999. Solar Zenith angle is regular almost (about 50 deg.). And measurement area is same area.
The graph of Fig3.1.3.3 is shown BRDF on principal plane for each band. (wavelength). Vertical axis of the graph is showing reflectance. The horizontal axis is showing scan angle. When scan angle is less than 0, scan is showing backward scan. Drawing of dot is grand truth data. Drawing of line is showing second regression curve. Function of second regression curve is written down under the graph.
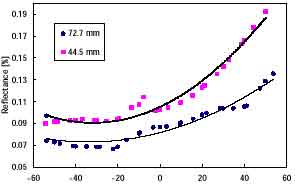
44.5 mm regression curve- - - -y = 1E-05x2 + 0.0009x + 0.1052 R 2 = 0.96924
72.5 mm regression curve -------y = 8E-06x2 + 0.0005x + 0.0818 R 2 = 0.9032
Fig. 3.1 Comparison of BRDF for different grass height (OCTS Band 4)
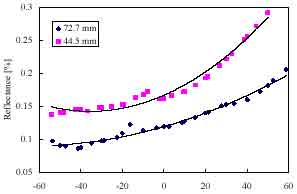
44.5 mm regression curve- - - -y = 2E-05x2 + 0.0014x + 0.1666 R 2 = 0.974
72.5 mm regression curve -------y = 7E-06x2 + 0.0009x + 0.1188 R 2 = 0.9779
Fig. 3.2 Comparison of BRDF for different grass height (OCTS Band 6)
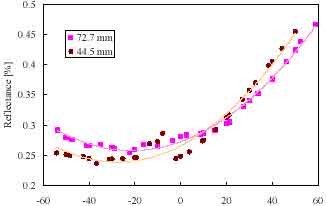
44.5 mm regression curve- - - y = 4E-05x2 + 0.002x + 0.2658 R 2 = 0.9703
72.5 mm regression curve -------y = 3E-05x2 + 0.0014x + 0.2726 R 2 = 0.9927
Fig. 3.3 Comparison of BRDF for different grass height (OCTS Band 4)
5. Conclusions and Discussion
We understood the following as a result of processing.
We thank The local government in Mandalgobi, the Meteorological Center in Mandalgobi and The Ministry for Nature and Environment, The Information and Computer Center.
This work has been supported by CREST (Core Research for Evolutional Science and Technology) of Japan Science and Technology Corporation (JST).
Reference
When an analysis of physical quantity of vegetation using a satellite remote-sensing technology, it is very effective for monitoring of a global area. However, these satellite data include many errors by an atmosphere, a sun-target-sensor geometry, sensor characteristics and so on. BRDF (Bi-directional Reflectance Distribution Factor) is one of them. And almost researcher should not use that, and except that. We are understood that if we corect BRDF error for satellite data, we need some geometric information, LAI, and another information. We changed our thought. Using BRDF characteristics for satellite data analysis, we will possible to obtain some information for satellite data. This study is first step of using BRDF analysis for satellite.
1. Introduction
It is (1999, Yamamoto etc.) that is understanding that is estimated with a high correlation that the information of a height of grass is adopted, in the case that estimate biomass and calculate NDVI more the data of the spectrum reflection rate that was obtained with location observation. However, in the case that this is adapted to the satellite sensor the information of the height of grass is a present condition to be estimating biomass from only NDVI, without being proposed to estimate from the satellite.
The information etc. of the position information, the sun of the reflection rate, sensor of the reflection rate, soil of a/the height of grass, stock number, plain are being substituted, in the BRDF model that Watanabe etc. proposed in 1998. It is make the multidimensional simultaneous equations of the coefficient such as grass canopy height, stock numbers that can not estimate this model, from the satellite sensor such as grass canopy height, stock several, that I use several bands of the many channel sensors of GLI, MODIS etc.
2. Objectives
The main purposes of this study are as follows:
- A study of relationship between BRDF and Grass Canopy Height for ground truth data.
- Estimation of Grass Canopy Height using its BRDF Property
Ground truth
We measured BRDF using our original system (Fig. 2.1 and 2.2) in 1998 and 1999. The measurement areas were located in Mongolian grassland. The areas were homogeneity, and not influenced by geographical (Fig 2.3). In 1998, there was much rain, therefore vegetation condition was very good. And grasses had grown, while we were measuring. However, in 1999, there was few rain. And growth of grasses was not so good.
However, we were obtain data of deferent grass canopy height at same measurement area. And we compared with those data, and study relationship between BRDF and grass canopy height. Table 2.1 is obtained and using data for study relationship.
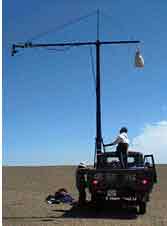 fig. 2.1 BRDF Measurement System |
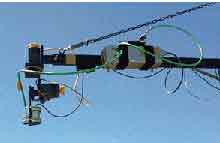
Fig. 2.2 Sensor Mount |
Table 2.1 List of using Field Data
| Date | Vegetation Coverage (%) | Grass Height (cm) |
| 1998/8/9 | 15% | 7.72 |
| 1998/8/10 | 5.40% | 6.65 |
| 1998/8/11 | 7.90% | 8.3 |
| 1998/8/19 | 9% | 4.45 |
| 1998/8/22 | 4% | 6.31 |
4. Results
We did an analysis in accordance with the band of OCTS. In this section, the characteristic of BRDF by the difference of height of grass is shown(Fig3.1 ~ 3.3). Using analyzing data in this section is that I observed in, 17:00 on August 9, 1998 here and we are using the data that I observed in 16:00 on August 19, 1999. Solar Zenith angle is regular almost (about 50 deg.). And measurement area is same area.
The graph of Fig3.1.3.3 is shown BRDF on principal plane for each band. (wavelength). Vertical axis of the graph is showing reflectance. The horizontal axis is showing scan angle. When scan angle is less than 0, scan is showing backward scan. Drawing of dot is grand truth data. Drawing of line is showing second regression curve. Function of second regression curve is written down under the graph.
44.5 mm regression curve- - - -y = 1E-05x2 + 0.0009x + 0.1052 R 2 = 0.96924
72.5 mm regression curve -------y = 8E-06x2 + 0.0005x + 0.0818 R 2 = 0.9032
Fig. 3.1 Comparison of BRDF for different grass height (OCTS Band 4)
44.5 mm regression curve- - - -y = 2E-05x2 + 0.0014x + 0.1666 R 2 = 0.974
72.5 mm regression curve -------y = 7E-06x2 + 0.0009x + 0.1188 R 2 = 0.9779
Fig. 3.2 Comparison of BRDF for different grass height (OCTS Band 6)
44.5 mm regression curve- - - y = 4E-05x2 + 0.002x + 0.2658 R 2 = 0.9703
72.5 mm regression curve -------y = 3E-05x2 + 0.0014x + 0.2726 R 2 = 0.9927
Fig. 3.3 Comparison of BRDF for different grass height (OCTS Band 4)
5. Conclusions and Discussion
We understood the following as a result of processing.
- 1.Band4 and Ban6 have most similar characteristics between BRDF and grass canopy height. Smaller height of grass canopy is more large fluctuation of Reflectance for scan angle than taller that.
- 2. Band 8 has most interesting characteristics between BRDF and grass canopy height. When scan is backward scan, reflectance of taller height of grass canopy is lager. When reflectance is foreward scan is forward scan, reflectance of smaller height of grass canopy is lager. Therefor grass canopy smaller height has more large fluctuation of Reflectance than smaller that.
We thank The local government in Mandalgobi, the Meteorological Center in Mandalgobi and The Ministry for Nature and Environment, The Information and Computer Center.
This work has been supported by CREST (Core Research for Evolutional Science and Technology) of Japan Science and Technology Corporation (JST).
Reference
- Chihiro WATANABE, Yoshiaki HONDA, Koji KAJIWARA The Study of Bi-directional Reflectance Distribution Function(BRDF) for Grassland, ACRS,p-23-1-5,1997