| GISdevelopment.net ---> AARS ---> ACRS 1999 ---> Poster Session 1 |
Geometric and spectral
analyses of Merged remotely sensed images
Hao-Hsiung
Huang and Yi-Sheng
Hsieh
Associate Professor and Graduate Student
Department of Land Economics
National Cheng-Chi University
64, Sec. 2, Tzu-Nan Road, Wensan, Taipei, 116
Tel: (886)-2-2938-7586 Fax: (886)-2-2939-0251
E-mail: hhh@nccu.edu.tw and g7257016@grad.cc.nccu.edu.tw
CHINA TAIPEI
Keywords: Merging Images, Image
Processing, Unsupervised ClassificationAssociate Professor and Graduate Student
Department of Land Economics
National Cheng-Chi University
64, Sec. 2, Tzu-Nan Road, Wensan, Taipei, 116
Tel: (886)-2-2938-7586 Fax: (886)-2-2939-0251
E-mail: hhh@nccu.edu.tw and g7257016@grad.cc.nccu.edu.tw
CHINA TAIPEI
Abstract
The research attempts to merge different types of registered remotely sensed images by the use of simple band substitution method, color space transformation and substitution method, and band arithmetic operation method respectively. SPOT PAN data, SPOT XS data, and digitized aerial photography are processed for merging experiment. Merged images were then classified using unsupervised method, and compared with each other. The result indicates that band arithmetic operation method for merging SPOT XS data and digitized aerial photography has the best visual display. On the other hand, color space transformation and substitution method for merging SPOT XS data and digitized aerial photography has the least omission error.
Introduction
Merging images obtained by different remote sensors can take advantage of the unique characteristics of each particular data set (Chavez, 1986). Moreover, combination of image data collected by two different systems may have information from both sensors. Therefore, many studies(Jensen et al., 1990; Ehlers et al., 1990, Hallada, 1986; Welch and Ehlers, 1987; Chavez and Bowell, 1988; Chavez, 1986; Grasso., 1993) have been made of digital images merged for processing and analysis.
However, remotely sensed images acquired using different sensors usually have different geometric and spectral resolutions. Improvement of the two resolutions may assist terrain interpretation and mapping when merging images, thus, is the main consideration when the method is selected for merging.
Test area and data sources, images merging, and results are described in the following sections.
Test Area and Data Sources
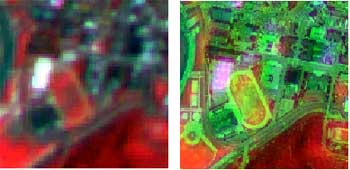
Three data sets, digitized panchromatic aerial photograph, SPOT panchromatic (PAN) data, and SPOT multispectral (XS) data shown in Figs. 1, 2, and 3 respectively, are used in this study. The campus of National Chengchi University, located in the southeast corner of Taipei is the test area of this study. The digitized aerial photography was ortho-rectified, and resampled to a pixel size of 1m. The SPOT PAN and XS data sets were also ortho-rectified, and registered to the digitized aerial photography. All data sets have the same pixel size of 1m when co-registered to each other.
Images Merging
Three methods, simple band substitution, color space transformation and substitution, and band arithmetic operation are tested in this study. These methods are frequently used.
Band Substitution
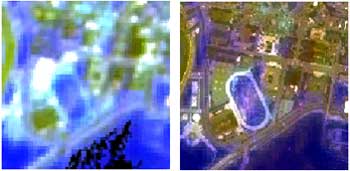
The SPOT PAN data is a record of both green and red energy. Therefore, it can be a good substitute for either the green (SPOT XS1) or red (SPOT XS2) bands (Jensen, 1996). The merged data set with SPOT XS3(near IR), SPOT PAN, and SPOT XS1 in the RGB image memory planes, respectively, is shown in Figure 4. The merged data set with SPOT XS3, digitized aerial photography, and SPOT XS1 in the RGB image memory planes, respectively, is shown in Figure 5.
Color Space Transformation and Substitution
Remote sensed data presented in the RGB color coordinate system can be transformed into an intensity-hue-saturation (IHS) color coordinate system for visual analysis. The IHS color coordinate system can be based on a hypothetical color sphere. Intensity indicates the total brightness of a color. Hue is the average wavelength of color. Saturation refers the purity of the color.
The procedure shown as below (Schowengerdt, 1983) involves transforming the SPOT XS image from the RGB to the IHS. The SPOT PAN image or digitized aerial photography is then substituted for the intensity and the IHS transforms back into the RGB. Such an approach is used to produce Figure 6 and Figure 7.
RGB to IHS: Three bands of remote sensor data in RGB color space are transformed into three bands in IHS color space. The equations used in this study are as follow: (Gonzalez and Woods, 1992)
Contrast enhancement: The image of high-spatial-resolution, (e.g., SPOT PAN data or digitized aerial photography) is contrast stretched so that it has approximately the same variance and mean as the intensity (I') image.
Substitution: The stretched image of high-spatial-resolution is substituted for the intensity (I') image.
I'H'S' to R'G'B': The modified I'H'S' image is transformed back into R'G'B' color space using an inverse IHS transformation listed as below:

Band Arithmetic Operation
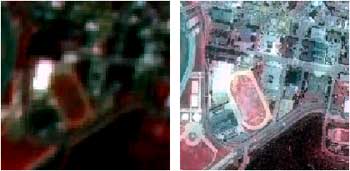
It is possible to improve the geometric resolution of an image by band arithmetic operation. The operation involves summing, differencing, multiplying, and ratioing different sources of images. The study simply substitutes the band computed by the following equations for three bands of the SPOT XS1 data. The results are shown in Figure 8 and Figure 9.
Results
Visual image interpretation and an unsupervised classification were employed to evaluate and analyze the merging images.
Visual Image Interpretation
As shown in Figures 4-9, it may be noted that the merged data set with SPOT XS3, SPOT PAN, and SPOT XS1 using the band substitution method has a very similar spectral appearance what the original SPOT XS has. The merged data set with SPOT XS3, digitized aerial photography, and SPOT XS1 using the band substitution method has greater spatial variability, but worse spectral details. The merged data set with SPOT XS3, digitized aerial photography, and SPOT XS1 by the band arithmetic operation method has fine geometric as well as spectral details. The results of the color space transformation and substitution method do not have good improvement as another two methods have. This is due to the SPOT XS image contain an infrared band, the transformation equations used might not be suited for.
Unsupervised Classification
In the unsupervised classification the spectral classes in a scene are found automatically. This approach has been found suitable for generalized land-cover mapping. There are many clustering algorithms that have been developed to determine the natural spectral classes present in a data set. A widely used clustering algorithm is the Iterative Self-Organizing Data Analysis Technique (ISODATA). This method is used, therefore, to classify the merging images. Classified data is then compare with classified data of the original SPOT XS data.
The unclassified percentage and total accuracy of error matrix of the classification map for each merging image are listed in Table 1. The merged data set with SPOT XS3, digitized aerial photography, and SPOT XS1 by the IHS method has been found to have the lowest unclassified percentage. It means that the spectral characteristics of this merged data set is similar to what the original SPOT XS has. Furthermore, no one total accuracy of all merged data sets has exceeded 20%. It shows that the greater part of merged data set has been changed, but is still related to original one.
Table 1. Unclassified percentage and total accuracy of
error matrix of the classification map from each merging image
| Merging Method | Unclassified percentage (%) |
total accuracy (%) |
| Band substitution (SPOT PAN) | 47.30 | 8.11 |
| Band substitution (Aerial data) | 46.80 | 16.93 |
| IHS(SPOT PAN) | 1.94 | 9.19 |
| IHS(Aerial data) | 0.00 | 11.41 |
| Band operation (SPOT PAN) | 41.25 | 13.32 |
| Band operation (Aerial data) | 0.12 | 5.60 |
Summary
Three different data sets have been merged and three methods used to extract the best information from both geometric and spectral components. As mentioned above, merging the SPOT XS and digitized aerial photography into single data sets having spectral (green to near IR) and spatial (1m) properties.
Although the IHS transformation does not have the natural visual results, the integrated images of this method still have the best classified effect.
Merging the SPOT XS3, digitized aerial photography, and SPOT XS1 data by th use of the band arithmetic operation method has improved both geometric appearance and spectral interpretation. The resultant merged data sets also have a low unclassified percentage.
Reference
- Chavez, P. S., Jr., 1986. Digital merging of Landsat TM and digitized NHAP data for 1:24,000 scale image mapping, Photogrammetric Engineering & Remote Sensing, 52(10), pp. 1637-1646.
- Chavez, P. S., and J. A. Bowell 1988. Comparison of the spectral information content of Landsat Thematic Mapper and SPOT for three different sites in the Phoenix, Arizona Region, Photogrammetric Engineering & Remote Sensing, 54(12), pp. 1699-1708.
- Ehlers, M., M. A. Jadkowski, R. R. Howard, and D. E. Brostuen 1990. Application of SPOT data for regional growth analysis and local planning, Photogrammetric Engineering & Remote Sensing, 56(2), pp. 175-180.
- Gonzalez, R. C. and R. E. Woods 1992. Digital image processing, Addison-Wesley.
- Grasso, D. N. 1993. Applications of the IHS color transformation for 1:24,000-scale geologic mapping: A low cost SPOT alternative, Photogrammetric Engineering & Remote Sensing, 59(1), pp. 73-80.
- Jensen, J. R. 1996. Introductory digital image processing: A remote sensing perspective, Prentice Hall.
- Jensen, J. R., E. W. Ramsey, J. M. Holmes, J. E. Michel, B. Savitsky, and B. A. Davis 1990. Enviromental Sensitivity Index (ESI) Mapping for Oil Spills Using Remote Sensing and Geographic Information System Technology, International Journal of Geographical Information Systems, 4(2), pp. 181-201.
- Schowengerdt, R. A. 1983. Techniques for Image Processing and Classification in Remote Sensing, Academic, New York.
- Welch, R. and Ehlers 1987. Merging Multiresolution SPOT HRV and Landsat TM Data, Photogrammetric Engineering & Remote Sensing, 53(3), pp. 301-303.
 | ||
| Fig 1. Aerial Image | Fig 2. SPOT PAN | Fig 3. SPOT XS |
 | |
| Fig 4. Band substitution (PAN) | Fig 5. Band substitution (Aerial) |
 | |
| Fig 6. IHS (PAN) | Fig 7. IHS (Aerial) |
 | |
| Fig 8. Bands
Operation (PAN) |
Fig 9. Bands Operation (Aerial) |