| GISdevelopment.net ---> AARS ---> ACRS 1999 ---> Poster Session 1 |
Preliminary Classification of
Infrared Aerial Photographs using an Advanced Algorithm
Jaemes Driver
GIS Analyst
Blue Mountains city Council
2 Civic Place Katoomba, NSW 2780
Tel: 02 4780-5512 Fax: 02 4780-5721
E-mail: jdriver@bmcc.nsw.gov.au
Web :http://www.bmcc.nsw.gov.au/
Geoff Robinson
Environmental Planner
Blue Mountains City Council
2 Civic Place Katoomaba, NSW
Tel: 02 4780-5512 Fax: 02 4780-5721
E-mail: grobinson@bmcc,nsw.gov.au
Web :http://www.bmcc.nsw.gov.au/
Dr Abdullah Mah (Phd in Remote Sensing)
Training and Application Consultantant for Asia Pacific Region
Earth Resource Mapping
Level 2, 87 Colin Street West Perth, WA 6005
Tel: 08 9388-2900
E-mail: Abdullah@ermapper.com.au
Web :http://www.ermapper.com/
Abstract
GIS Analyst
Blue Mountains city Council
2 Civic Place Katoomba, NSW 2780
Tel: 02 4780-5512 Fax: 02 4780-5721
E-mail: jdriver@bmcc.nsw.gov.au
Web :http://www.bmcc.nsw.gov.au/
Geoff Robinson
Environmental Planner
Blue Mountains City Council
2 Civic Place Katoomaba, NSW
Tel: 02 4780-5512 Fax: 02 4780-5721
E-mail: grobinson@bmcc,nsw.gov.au
Web :http://www.bmcc.nsw.gov.au/
Dr Abdullah Mah (Phd in Remote Sensing)
Training and Application Consultantant for Asia Pacific Region
Earth Resource Mapping
Level 2, 87 Colin Street West Perth, WA 6005
Tel: 08 9388-2900
E-mail: Abdullah@ermapper.com.au
Web :http://www.ermapper.com/
Infrared (IR) Aerial Photographs of the Blue Mountains area, acquired with a Kodak multi-lens frame camera, are used to map vegetation communities. The present study is part of the project undertaken by the Blue Mountains City Council to map different types of vegetation accurately using both the conventional and Remote Sensing methods. Classifying the IR photos without any enhancement provides a poor result. An advanced technique using Decorrelation Stretched IR photos, Principal components and band ratios resulted with a much better classified image. The technique is presented in this paper. Subsequent study will evaluate the accuracy of this technique.
Keywords Infrared (IR) Aerial Photographs, Decorrelation Stretch, Principal Component Analysis, Band Ratio, Unsupervised Classification, Vignetting.
1 Introduction
The Blue Mountains is renowned for its unique environmental character. The natural ecosystems of the Blue Mountains that make up this character are recognized for therir outstanding ecological, scientific, recreational and heritage values and are deserving of nomination for world Heritage listing.
The different types of vegetation, (Rain Forest, Tall Open-Forest, Open-Forest, Montane Heath, Cekline Vegetation Escarpment and Rock Outcrop Vegetation, Swamps, Woodland/Low Woodland) that occur throughout the Blue Mountains area are the result of millions of year of evolution. Individual plant species have adapted to cope with the suite of environmental and physical factors that influence species habitats, including local geology, topography, climate and fire regimes. Vegetation communities in the Mountains are the combination of a range of plant species associated with a particular habitat. They are usually characterized by species composition and vegetation structure, and also represent fauna habitats thus providing a means of describing fauna distribution patterns as well as plant patterns.
The Blue Mountains City Council realizes the importance to preserve the native plants and to maintain the natural habitats of the native animals and hence is undertaking a vegetation mapping project. As part of the vegetation communities mapping project of the Blue Mountains City Council, the authors used Infrared Aerial photographs taken by Kodak multi-lens frame camera to map vegetation. Infrared Aerial photographs are used so as to take the advantage of the high Near Infrared reflectance of vegetation and high resolution of the Aerial Photographs (~14 cms resolution) in mapping vegetation.
1.1 Objective of the project
The main objective of the present study is to develop an algorithm that accurately map vegetation communities of the Blue Mountains area and subsequently to produce an accurate vegetation map of the area.
II Previous Studies
The standard methodology for conservation-related vegetation studies involves a process of compiling a plant species and vegetation community inventory for the survey area, mapping of the vegetation communities, and identification of the species and communities of special conservation significance (Smith & Smith 1998). There have been a number of vegetation mapping exercises that have classified vegetation communities in the Blue Mountains including Smith and Smith (1990), smith and smith (1995a-e) and Smith & smith (1998). These have provided valuable vegetation distribution data useful for regional planning purpose and to some extent, for local identification of significant vegetation.
The Smith and Smith (1995a-e) mapped vegetation from aerial photograph interpretation and field checked at a number of sites. The native vegetation types that wee recognized in the study were based on previous studies. The mapping covered urban areas of the Blue Mountains and adjacent lands up to 500m from the study area boundaries. Most parts of the study area were mapped from Qascophoto Cumberland 1:15000 colour photographs taken in April 1992. The northern third of North Katoomba was mapped from CMA 1:13000 colour photographs taken in May 1987.
There are concerns that relate to issues of the possibility that significant flora and fauna habitats have been inaccurately mapped, and the adequacy of protection for other areas of conservation significance which are not identified as significant in previous studies. Hence, the Blue Mountains city Council is undertaking further mapping of the extent of significant flora and fauna habitats in various areas to investigate claims that significant flora and fauna habitats that potentially cover a large number of land parcels have been grossly underestimated.
III Identification of Vegetation Communities
Using existing information from previous vegetation studies, native vegetation types that occur in the Blue Mountains have been described to provide a standard description of vegetation communities that abates differences between previous studies. The vegetation types correlated with vegetation structural information
Identify vegetation communities. Vegetation structural information is to be based on the structural classification system devised by specht (1970).
Vegetation Description + Vegetation Structure = Vegetation Community
The vegetation communities located within the study for the purpose of this paper were :
- Eucalyptus piperita-Angophora costata Open-forest(Y)
- Eucalyptus piperita-E. radiata Open-forest(Q)
- Eucalyptus piperita-E. sieberi Open-forest/Woodland(P)
- Eucalyptus manifera-E. radiata Woodland (M)
- Eucalyptus sclerophylla Woodland/Low Woodland (L)
- Montane Health (H)
- Blue Mountains Sedge Swamps (S)
- Escarpment and Rock Outcrop Vegetation
- Creekline Vegetation
Ortho-rectified (1:6000) infra red images of the Blue Mountains city taken in 1999 are used in the present study. The present study is to develop an algorithm that can map different vegetation communities accurately. Hence, as a test case an Infrared Airphoto that covers an area of 1.3 x .9 km2 and that has some groundtruthed information of vegetation is chosen. It consits of 6247 lines and 9218 columns with a resolution of 0.137 metre. The IR image has three bands which have information recoreded using wavelengths from Near Infrared, Visible Red and Visible Green electromagnetic spectrum. The size of the file is 172.75 MB. An index map of the study area is shown in Figure 1.
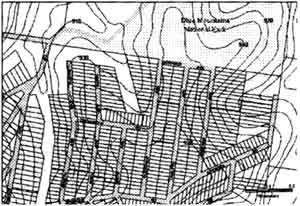
Figure 1: Index map - North Katomba
4.1 Distortions or noises introduced in Aerial Photographs
The following are some of the noises that may be introduced into IR Aerial Phtographs.
- Possible inhomogeneity of the recording medium, photographic emulsion (silver halide crystals held by a solidified gelatin) coated on a base or support.
- Inconsistency in film development process
- Over or under-exposure time in printing the photo
- Instability of the aircraft (altitude, pitch, roll, yaw)
- Position of the Sun at the time the photo was taken
- Exposure fall off which is the variation in focal plane exposure purely associated with the distance an image point is from the image center. (Vignetting effect) (Lillesand and Kieffer, 1994)
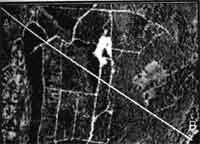
Figure 2. RGB composite of original IR, VisRed, VisGreen Bands of IR photo. (A-B is the traverse line of Figure 3.)
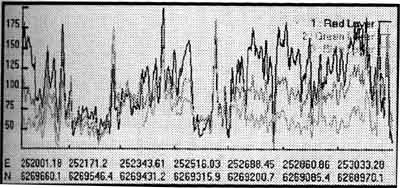
Figure 3. Spectral reflectance of Red Layer (NIR-Band1), Green Layer (VisRed-Band2) and Blue Layer (VisGreen-Band3) of traverse A-B on Figure 2.
4.2 Processing Original dataset
An Unsupervised Classification was carried out on the original 3 bands of the IR Airphoto. A standard deviation of 4.5 and a minimum distance between class mean of 3.2 were used in the classification. The classified image with five classes (Fig. 4) gives some classes that correspond to field data. The Bare Ground (B) was clearly mapped. However, other classes such as Swamp(S), Tall Open Forest/Open Forest(P) are not clearly defined.
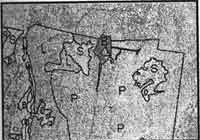
Figure 4. Five classes (Light Brown, Dark Blue, Cyan, Yellow and Green) of the original IR photo using Unsupervised classification. Bare Ground (B), Tall Open Forest/Open Forest (P), Swamp (S), Woodland (L-Eucalptus sclerophylla), Woodland (M-Eucalyptus Manifera) and Open Forest (Q) are field classes, displayed as vector for comparison.
4.3 Image Enhancement & Vegetation Mapping
To acquire the maximum spectral variation of the IR image, Decorrelation Stretch was performed Stretch was performed. In the process of carrying out the Decorrelation Stretch, Principal Components (PC) 1,2 & 3 were created. The multi-variate statistical analysis of Principal Component Analysis map co-variances of the input three bands into new axes which are orthogonal to each other (Richards, 1995). Since the first Principal Component has the most variances of the three input bands, with reducing co-variances in lower components, the last component (PC3) has the most noise. The RGB composite of PC123 revealed the vignetting effect (Fig. 5) and the traverses of the PC1,2 & 3 (Fig.6) suggest that the noise caused by vignetting effect has been accumulated in PC3.
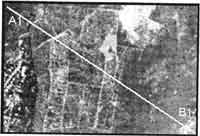
Figure 5. RGB composite of PC123 of original IR, VisGreen bands IR photo. (A1-B1 is the traverse line of Figure 6).
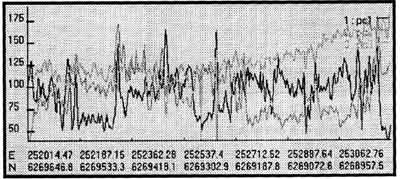
Figure 6. Digital Number (DN) values of PC1, 2 & 3 of traverse A1-B1 on Figure 5.
Using the anti-vignetting formula of ER Mapper, the vignetting effect accumulated in PC3 was corrected. The Decorrelation Stretch was performed on the PC1, 2 and vignetting effect corrected PC3. Then the Decorrelation Stretched PC1, 2& 3 were inverted back to the orginal space of the NIR, VisRed and VisBlue bands. The RGB composite of the Decorrelation Stretched 3 bands provide much more spectral variation (Fig.7) than the original RGB composite of the IR Airphoto (Fig. 2).
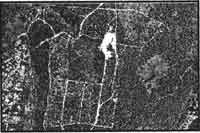
Figure 7. RGB composite of enhanced IR, VisRed, VisGreen bands IR photo.
Judging from the Eigenvector loading of Bands 1,2,3 of the IR Airphoto into PC1, 2, 3, the highest variation between the loading of the three bands is an PC number 2 (Table 1). Since the distinctive high NIR reflectance of vegetation is in band1 and that its loading is negative, PC2 is inverted to highlight vegetation as bright areas (Fig.8).
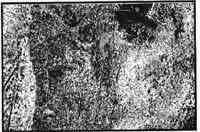
Figure8. Inverted PC2 of the IR photo, Highlighting vegetation.
| Covariance Eigenvectors | PC1 | PC2 | PC3 |
| Band1 (NIR) | 0.337 | -0.689 | -0.641 |
| Band2 (Visible Red) | 0.447 | -0.483 | 0.753 |
| Band3 (Visible Green) | 0.829 | 0.540 | -0.145 |
Healthy vegetation has distinctive high spectral reflectance in NIR and chlorophyll absorption feature in Visible Red. To discriminate vegetation from other surface cover types such as soil and water, a band ratio of band1/band2 (NIR/VisRed) was carried out. The band ratio highlighted the vegetation in bright areas (Fig.9).
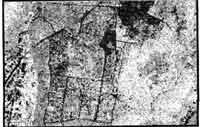
Figure 9. Raito Band IR/VisRed of the IR photo, highlighting vegetation.
Using the Decorrelation Stretched Band 1,2,3, inverted PC2 and band ratio IR/VisRed and Unsupervised classification was performed. To compare the two classified images, parameters such as standard deviation and minimum distance used in the classification were the same as those used in the classification were the same as those used in the classification for the original data. Five classes were mapped. The classified has classes much more clearly defined and are comparable with the field data (Fig. 10). Ground trusted information suggest that there are more than one vegetation community in the P (Tall Open Forest / Open Forest) class. An attempt was made to further separate two classes of the P and also of the S classes. A total to seven classes were mapped and the result indicates that it is quite probable that more classes were mapped and the result indicates that it is quite probable that more classes can be mapped using the enhanced data (Fig. 11). Accuracy assessment will be further carried out with field verification. The advanced algorithm for the classification of IR Airphotos mentioned in the paper will be used to map different vegetation communities of the Blue Mountains area that covers more than 5,000 KM2.
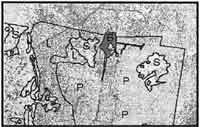
Figure 10: Five classes (Light Brown, Dark Blue, Cyan, Yellow and Green) of the enhanced IR photo using Unsurpervised classification. Bare Ground (B), Tall Open Forest/Open Forest (P), Swamp (S), Woodland (L-Eucalyptus Sclerophylla), Woodland (M-Eucalyptus Manifera) and Open Forest (Q) are field classes, displayed as vector for comparison.
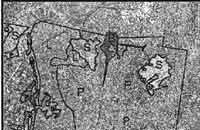
Figure 11: Seven classes (Light Brown, Dark Blue, Cyan, Yellow, Pink, Light Green and Dark Green) of the Enhanced IR photo using Unsupervised classification. Bare Ground (B), Tall Open Forest/Open Forest (P), Swamp (S), Woodland (L-Eucalyptus Sclerophylla), Woodland (M-Eucalyptus Manifera) and Open Forest (Q) are field classes, displayed as vector for comparison.
V Conclusions
The present study has developed and advanced algorithm to map vegetation communities using IR Aerial Photographs of Blue Mountains. To acquire maximum spectral variation and accuracy of vegetation mapping, it is necessary to reduce noise such as Vignetting and perform Decorrelation Stretch on the Aerial Photograph. Principal Component Analysis can also provide additional useful information of vegetation. Users should check at the statistics of the dataset, determine which Principal Component to use in highlighting vegetation based on the maximum Eigenvalues input of the NIR band and the maximum variation with other bands. Band ratio of NIR / VisRed also provides additional useful information of vegetation. Using the Decorrelation Stretched IR, visRed, visGreen, PC2 and IR / VisRed ratio images one can perform Supervised or Unsupervised Classification. In this study only the Unsupervised classification was carried out. The classified was carried out. The classified image using the advanced algorithm developed in the present study resulted with vegetation classes that are quite comparable with previously collected field data.
References
- Smith, Judy & smith, Peter, (1988). "Significant Vegetation Types within the city of Blue Mountains", P& J Smith Ecological Consultants.
- Smith, J & smith, P., (1994). "Flora & Fauna Study for Blue Mountains Environmental Management plan Study Area 2: Katoomba to Wentworth Falls", P&J smith Ecological consultants.
- Lillesand, T.M. and Kieffer, R.W. (1994) Remote Sensing and Image Interpretation, John Wiley & sons, Inc. Publications, 750 p.
- Richards, J. A. (1995) Remote Sensing Image Analysis (An Introduction), (2nd Edition), springer-Verlag Publication, 340 p.