| GISdevelopment.net ---> AARS ---> ACRS 1999 ---> Poster Session 1 |
Comparison of jers-1 and
radarsat synthetic aperture Radar data for mapping mangrove and its
biomass
Mazlan Hashim and Wan Hazli
Wan Kadir
Department of Remote Sensing
Faculty of Geoinformation Science & Engineering
Universiti Teknologi Malaysia
81310 UTM, Skudai, Johor, Malaysia
Tel: +607-5502873, Fax: +607-5566163,
E-mail: mazlan@fksg.utm.my
AbstractDepartment of Remote Sensing
Faculty of Geoinformation Science & Engineering
Universiti Teknologi Malaysia
81310 UTM, Skudai, Johor, Malaysia
Tel: +607-5502873, Fax: +607-5566163,
E-mail: mazlan@fksg.utm.my
This paper has reviewed comparison of classification of mangrove forest at species-level, and estimation of mangrove biomass using JERS-1 SAR and Radarsat SAR (standard mode) data. Both of these comparisons were made at selected test site in Sungai Pulai Mangrove Forest Reserve in Malaysia. The results demonstrated the utility of SAR data as potential source in mapping mangrove classes and indicator for biomass. Although there has been limited availability of exhaustive sampling points done accessibility at the test site, but the results indicated the evidence of C and L band utility for mangrove mapping and biomass estimation.
Introduction
Mangrove forests grow exclusively in the intertidal zone, where they are greatly influenced by the coastal environment. Mangrove forests are becoming dwindling resources because of their continued alienation for various land uses that are assumed to be of greater economic values. In Malaysia alone mangrove forest area have decreased by 46.8 percent of the original gazetted area, i.e. from 505, 300 hectares in 1980 to 269, 000 hectares in 1990 (Clough, 1993). Due to its nature, especially, of its remoteness and limited accessibility, the detecting and mapping of these changes using conventional technique are elaborately time consuming and very costly. In this study, SAR data which is independent of to cloud cover and weather interference are examined for mapping mangrove and estimation of mangrove biomass.
In recent years, SAR data have been used in classification of vegetation precisely forest over tropical regions. However, only limited studies have been reported on mapping mangrove forest (Mazlan Hashim, 1999) Moreover, none of these studies have ever been attempted to examine the potential of SAR to classify mangrove forest at species level. In this context, this paper is focused on two issues : (i) analyse whether or not mangrove species can be categorized using typical satellite-based SAR resolution, and (ii) retrieve of biomass information based on radar backscatter.
Apart from vegetation studies using SAR data, estimation of forest biomass has widely been reported but again very little effort have been undertaken for mangrove (Imhof, 1995). Previous studies have indicated that there exist strong correlation between radar backscatter with forest biomass, particularly of those SAR data acquired in L and P bands (Beaudoin et al., 1994). Based on these facts, it is also the main objective of this paper to report on the estimation of mangrove biomass using JERS-1 SAR and Radarsat SAR which were acquired in C band and L band, respectively.
Material and Method
Study area.
In order to validate of SAR data in extracting information pertinent to classify mangrove at species level and to estimate the biomass, a study area which is located in the southwest of Johore, Malaysia (Figure 1) – the Sungai Pulai mangrove forest reserve was selected. The study area covers approximately an area of 12.3 km x 18.0 km (centered at 103° 16’ E lat. and 1° 13’ N long.). In the past decade, this area although has been demarcated as reserve forest but lately has also been given way to conversion for land related development programs such as development of new port, aquaculture, charcoal-making industry as well as residential area for supporting the newly developed industries.
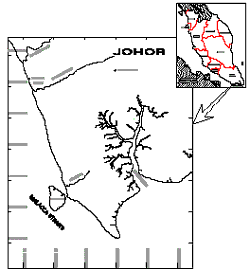
Figure 1 : The study area - Sungai Pulai Mangrove Forest Reserve and
corresponding JERS-1 and Radarsat SAR data of the area.
Digital Image Processing
The JERS-1 (processed at level 2.1 by NASDA- National Space Development Agency of Japan) and Radarsat (SGF-Path Image) data were used in this study. Specification of the data is tabulated in Table 1. The ancillary information used to support the study which includes the corresponding area topographic map (1:50,000 scale), related forestry records and documents were used as ground reference data. The extend of mangrove boundary given by the topographic map were digitized into digital image processing and used as “vector-overlay” in assisting the collection of training and later used in the accuracy assessment.
multi-temporal data employed in the study.
| Sensor | JERS-1 | Radarsat |
| Acquired date | Sept. 28, 1994 | Oct., 26, 1997 |
| Pixel size / resolution | 18 meter | 25 meter |
| Wavelength | 23.5 cm | 5.6 cm |
| Polarization | HH | HH |
Minimizing speckle
Minimization of speckle effects in SAR data are commonly carried out using adaptive radar filters (Lopes et al, 1990). In this study, Lee-Sigma filter at window size 7x7 showed the best result over mangrove forest in both images. This selection were made based on the analysis of the mean vectors before and after filtering operation as well as the coefficient of variance (Paudyal and Aschbacter, 1993).
Image Classification
The extracted pixels within the mangrove boundary were classified using combined unsupervised-supervised approach with maximum likelihood classifier. In this approach, the spectral classes generated in the unsupervised approach is refined based on the existing forestry records and ancillary data. Once the samples from all available classes within the area are known, training areas and signature vectors of these classes were then generated before supervised maximum likelihood classification was performed.
Biomass Estimation
In this study, we focussed on the estimation of mangrove biomass from radar backscattering of JERS-1 and Radarsat SAR data. Regression analysis of the sample biomass measured in the field with radar backscatter coefficient of JERS-1 and Radarsat SAR were examined using stepwise regression approach. Based on the regression analysis, the parameters describing the relationship of mangrove biomass to radar backscatter were used to calculate the biomass of the entire area. The computed biomass were then compared with the recently surveyed biomass of the area by Forestry Department (1996).
Ground truthings and analysis
Ground truthings were carried out for two reasons: (a) verifying the classified SAR data for accuracy analysis, and (b) to make in-situ measurements for biomass estimation. For verification, survey random samples were identified in the field where the position and corresponding class were noted, which later used in contingency matrix for classification assessments. Global positioning system are used in recording the positions of samples collected. In the biomass estimation, measurement of mangrove tree samples at selected sites for consist of the tree basal area, dbh (diameter at breast height), biomass by parts and density of trees.
Results and Discussion
Classification of mangrove and species determination
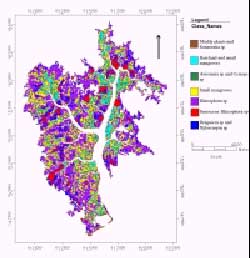
Unsupervised-supervised approach with maximum likelihood classifier was performed on JERS-1 and Radarsat image (Figure 2). Seven classes can be defined from JERS-1 and five classes from Radarsat. In both images, Rhizophora are still the dominant species where it covers 45.2 % of JERS-1 and 55.4 % of Radarsat data. Accuracy points were carefully selected to avoid error and confusion due to inclusion of mixed, border/edge pixels (Table 2).
Error matrix were created and figures for User’s Accuracy, Producer’s Accuracy, and Combined Accuracy (kappa statistic) compiled to evaluate the quality of each classification. User’s Accuracy is a ratio statistic compiled by dividing the number of pixels correctly assigned to a category by the total number of pixels to the category. Producer’s Accuracy is calculated by dividing the number of accuracy pixels correctly assigned to a category by the number of accuracy pixels selected for that category. These two measures are useful in defining the type of classifications errors made and provide differents perspectives of accuracy. Results show Radarsat that (5.6 cm wavelength) is less sensitive compare with JERS-1 (23.5 cm). The lower accuracy existence in mangrove classification mapping especially in study area due to the mixed species.
| Dataset Classes | JERS-1 SAR | Radarsat | ||
| User’s Accuracy |
Producer’s Accuracy |
User’s Accuracy |
Producer’s Accuracy | |
| Muddy plants and Sonneratia sp | 100% | 67% | 100% | 50% |
| Bareland and small mangroves | 50% | 44% | - | - |
| Avicennia sp and others small mangroves | - | - | 40% | 67% |
| Avicennia sp and Ceriops sp | 50% | 75% | - | - |
| Small mangroves | 50% | 38% | - | - |
| Rhizophora sp | 60% | 46% | 50% | 38% |
| Mature Rhizophora | 45% | 71% | 43% | 30% |
| Bruguiera sp and Xylocarpus sp | 43% | 50% | 45% | 45% |
| Overall Accuracy | 52 | 46 | ||
| KHAT | 43 | 30 | ||
 |
 |
(a) |
(b) |
| Figure 2: Mangrove species classified from (a) JERS-1 SAR, and (b) Radarsat | |
Biomass estimation
The stepwise regression analysis indicated that mangrove biomass in both image can reasonably be estimated by:
Radarsat SAR, B = 1004. 7e0.1352x (2)
where
B = total biomass in ton/ha.;s° = radar backscatter coefficient derived using; 20 log (DN) – 68.5 for JER-1 SAR and 10 log (DN 2 /A) + 10 log sin I for Radarsat SAR; A = scaling gain (5695770.5); I = Incident angle (20.2°);DN=digital number recorded from images.
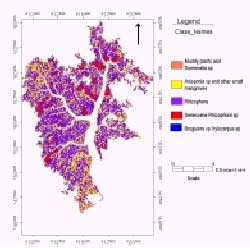
The computed biomass using the relationship is shown in equation (1) and equation (2) and is given in Figure 3. These computed biomass are then compared with biomass derived using most recent record of tree-age of the area compiled during fieldwork on 1998. For accuracy assessment, biomass value was divided to seven clasess in 100 ton/ha. range. Using random generation or more than 100 samples, the overall average accuracy of computed biomass in the seven tonnage categories is only at 40 percent. These results confirmed to recent similar biomass studies of mangrove forest using SAR that was carried in French Guiana and Bangladesh respectively. (Mougin et al., 1999). Detailed producer’s and user’s accuracy information is given in Table 3.
| Data | JERS-1 SAR | Radarsat | ||
| Biomass (ton/ha.) | User’s Accuracy | Producer’s Accuracy | User’s Accuracy | Producer’s Accuracy |
| Less than 100 | 50 % | 100% | 75 % | 75 % |
| 101 – 200 | 29 % | 71% | 29 % | 46 % |
| 201 – 300 | 29% | 42% | 33 % | 36 % |
| 301 – 400 | 50% | 42% | 31 % | 35 % |
| 401 – 500 | 45% | 36% | 45 % | 38 % |
| 501 – 600 | 12.5% | 27% | 31 % | 29 % |
| Over than 601 | 60% | 27% | 50 % | 33 % |
| Overall Accuracy | 39.3 | 36.8 | ||
| KHAT | 27.2 | 24.4 | ||
 |
 |
| (a) | (b) |
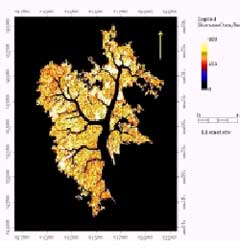
| Figure 3: Biomass derived from (a) JERS-1 SAR, and (b)Radarsat backscatter | |
An interesting result to be noted is that biomass for less than 200 ton/ha can be determined more accurately using SAR: For biomass less than 100 ton/ha were derived perfectly using the model adopted, and 71 percent accuracy is reported for biomass in the range of 100-200 ton/ha. The accuracy then degrades to 27 percent for biomass of more than 600 ton/ha. Lower accuracy was observed as biomass increases – two reasons that might contribute to this accuracy trend are: (1) non-representative regression model due to limited samples used in generating the biomass-backscatter relationship, (2) mixed species in area of larger biomass but only dominating pioneering species were accounted in derived biomass. However both these factors are yet to be improvised in near future due to the restriction in obtaining logistic support on comprehensive samples.
Conclusion
The results demonstrates the utility of SAR data as potential source in mapping classes and indicator for biomass. Although there has been limited availability of exhaustive sampling points particularly on focussed mangrove forest, but the results indicates the evidence of C band and L band utility for mangrove mapping and biomass estimation. The mangrove biomass estimation was found related to JERS-1 and Radarsat backscatter coefficient at r 2 = 0.5 and 0.31. The on-going and future task of this study is for decomposed forest’s SAR backscatter element to biomass estimation to other forest types.
References
- Beaudoin, A., T. LeTeon, S. Goze, E. Nezry, A. Lopes, E. Mougin, C. C. Hsu, H. C. Han, J. A. Kong and R. T. Shin (1994). “Retrieval of forest biomass from SAR data.” Int. J. Remote Sensing. 15 ; 1117-1124.
- Clough, B. F. (1993). The status and value of mangrove forests in Indonesia, Malaysia and Thailand: Summary. The economic and environmental values of mangrove forests and their present state of conservation in the South-East Asia/Pacific Region. P 1-10. Institute of Marine Science. Camberra, Australia.
- Imhoff, M. L. (1995). “A theoretical analysis of the effect of forest structure on synthetic aperture radar backscatter and the remote sensing of biomass.” IEEE Trans. Geosci. Remote Sensing .33(2): 341-352
- Lopes A., R. Touzi and E. Nezry (1990) “Adaptive filters and Scene Heterogeneity.” IEEE Trans. Geosci. Remote Sensing. 28(6); 992- 1000.
- Mazlan Hashim, Wan Hazli Wan Kadir, Lee Ken Yoong (1999). Global Rainforest Mapping Activities in Malaysia: Radar Remote Sensing for Forest Survey and Biomass Indicators; JERS-1 Science Program 99 PI Reports: Global Forest Monitoring and SAR Interferometry, Earth Observation Research Centre, National Space Development of Japan, 63-70.
- Mougin, E., C. Proisy and G. Marty (1999) “Multifrequency and multipolarization radar backscattering from mangrove forest.” Submitted to IEEE Transsactions on Geoscience and Remote Sensing.
- Paudyal, D. R and J. Aschbacter (1993) “Evaluation and performance test of selected SAR speckles filter.” Presented at the International Symposium “Operationalization Org. Remote Sensing” ITC Enschede, The Netherlands