| GISdevelopment.net ---> AARS ---> ACRS 1999 ---> Poster Session 1 |
Evaluation of forest and
nonforest classification capability of ILU image with dirrerent kinds of
pixel size and coherence Generation methodology
Chen Erxue1,
Betlem Rosich2, Li Zengyuan3
1, 3Chinese Academy of Forest Beijing, China, 100091
2ESRIN of European Space Agency
Keywords: Forest mapping, Coherence,
Classification, ERS SAR Tandem 1, 3Chinese Academy of Forest Beijing, China, 100091
2ESRIN of European Space Agency
Abstract
Forest and non-forest classification capability using Interferometric Land Use (ILU) image with three kinds of pixel size (50m, 75m and 100m) and two kinds of coherence generation methodology were evaluated. Ground truth data used included Land Use Map of the Zengcheng County and classification result based on Landsat TM image covering part of the experiment site. It was shown that there was not so much difference for ILU image with different pixel size to classify forest from non-forest. 50m-pixel- size ILU image was preferred for forest non-forest mapping. ILU image with low resolution such as 100m and 75m can also be used without too much accuracy loss compared with 50m. But if the National Stand: Specification for Making Photoplan of Remote Sensing should be in conformity to, only the 50m ILU image can be used for 1:250 000 forest mapping; The 75m and 100m ILU image can be used for 1:500 000 and 1:1 000 000 forest mapping. And new coherence methodology used in this test had no help to improve the forest classification accuracy.
Introduction
ERS SAR Tandem data is proved to be extremely useful for discriminating forest from non-forest in many areas of the world[1, 2]. So one project named “Mapping China Forest with ERS SAR Tandem”[3]was proposed with the aim to produce a forest map of China using ILU images generated with the Interferometric Quick Look (IQL) System at ESRIN. The final project output includes ILU color mosaic image with forest and non-forest vector layer in different map scale varying from 1:250 000 to 1:1 000 000. It’s not necessary and also impossible to produce forest map of such a big area as one whole province or the entire China using full resolution ILU image. So what kinds of pixel size or resolution ILU image is best for the generation of one certain scale forest map should be studied at first. This evaluation work has been carried out using the experiment site located in the South China-Zengcheng County where ground true database such as Land Use Map, Landsat TM image, DEM etc. has been established. Moreover, Two kinds of methodology will be evaluated here. We want to know if the classification result will have some improvement using the coherence image with topography correction.
ILU Images and Ground Truth Data
ILU Images Used for Evaluation
The experiment site, Zhengcheng County is located in the South China, 23°06'~23°37'N, 113°29'~113°59' E, the coverage of this county is about 2800 km2. The INSAR data used for the ILU image generation is showed in the table 1.
Master and slave intensity images with pixel size of 50m, 75m and 100m and coherence images processed by an ordinary methodology without topography correction and a new methodology with topography correction were generated using IQL System at ESRIN.
Table 1 ERS-1 and ERS-2 Tandem INSAR data used
|
| |||
| Items | Date | Track | Frame |
|
| |||
| ERS-1 | 1996-03-02 | 24211 | 3141 |
| ERS-2 | 1996-03-03 | 4538 | 3141 |
|
| |||
For each kinds of pixel size, the master and slave intensity images were used to produce Difference intensity image and Mean intensity image. The Difference image, Mean intensity image and Coherence image were combined to produce a color composite ILU image with Coherence image as Red, Mean intensity image as Green and Difference intensity image as Blue. So the output are six ILU images with the combination of three kinds of pixel size and two kinds of coherence methodology.
Ground True Data
Two kinds of ground truth data are available for the evaluation of forest mapping accuracy. The first one was the Land use map of Zengcheng County that was produced in 1990. As showed in figure 1, there were eight kinds of landuse type: forest (dark green), orchard (chartreuse), rice (orange), dry land (tan), grass land (cyan), farmland (tan), water body (blue) and urban (pink). As one thematic image layer, landuse types can be recoded to produce forest (dark green) and non-forest layer (tan) (Fig. 2), which would be used for ILU image classification accuracy evaluation. The second one was based on one scene of TM image acquired in March 1996. For one small part TM image of Zengcheng County, where forest and non-forest area can be clearly identified (Fig.3), supervised classification was applied to produce one small forest and non-forest map. The resulted forest map (Fig.4) was used as another kinds of ground truth data to evaluate forest and non-forest classification accuracy of ILU images.
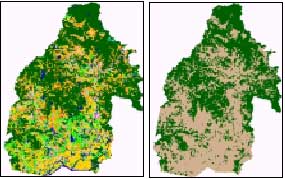 | |
| Fig.1 Land Use Map of Zhengcheng County | Fig.2 Forest & non-forest map derived from fig. 1 |
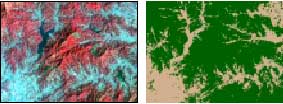 | |
| Fig.3 Tm image covering part
of Zhengcheng County |
Fig.4 Forest and non-forest map derived from TM |
Geometric Correction Reference
Image One scene of ESR-2 SAR PRI product image (1997.07.12) has been acquired and used for rice mapping in this County. DEM image of this County have been used with the satellite track parameters and imagery equations to generate the orth-rectified SAR image. This orth-rectified SAR image would be used as reference image to geo-reference all ILU images.
Evaluation Methodology
The six ILU images had to be geo-referenced to the orth-rectified SAR image (image to image) firstly in order to fully use the ground truth data for signature collecting and accuracy assessment. Then the signatures of several typical kinds of land use type were collected based on the ground truth data. After that, one classification methodology would be applied to do the classification. The classification result would be recoded to forest and non-forest and compared with the forest and non- forest ground truth data pixel by pixel to determine which kinds of ILU image can produce best forest and non-forest classification result. The main methodology was to be explained simply as the follows.
Classification Methodology
Once a set of reliable signatures has been created, the nest step is to perform a classification of the data. Each pixel is analyzed independently. The measurement vector for each pixel is compared to each signature, according to a decision rule, or algorithm. Pixels that pass the criteria that are established by the decision rule are then assigned to the class for that signature.
There are two decision rules used here. The first decision rule is parallelepiped decision rule, the data file value of the candidate pixel is compared to upper and lower limits. These limits can be either:
- The minimum and maximum data file value of each band in the signature;
- The mean of each band, plus and minus a number of standard deviations; and
- Any limits that you specify, based on your knowledge of the data and signatures. This knowledge may come from analysis of signature.
The second decision rule is maximum likelihood. This algorithm assumes that the histograms of the bands of data have normal distributions. If this is not the case, better results may be achieved using the parallelepiped decision rule. For signatures such as water body and urban, some histograms of them are really not normal distribution. So if we perform a first-pass parallelepiped classification before maximum likelihood classification, better result may be obtained. The developed classification flow diagram is showed in Fig 5.
Fig. 5 Classification Flow Diagram
Post-processing of classification result
The classification result has several kinds of land use types: forest, crop, urban, water body and layover area. Forest and layover area is combined to form the final forest type because almost all layover area fills into the area of forest area in land use map. The other types such as crop, urban, water body are combined to form the final non-forest type. In this forest and non-forest map, there are lots of class speckles that should be removed through some algorithm before the classification result can be used for mapping. This classification post-possessing can be called class speckle sieve. The minimum group of connected pixels that will be sieved as class speckle may be called sieve distance, which should be decided according to the class speckle density, pixel size and ground truth. For small pixel size, there may be much more class speckles then big pixel size, the sieve distance can be set a little larger. One class speckle filled area can be chosen as sieve effect assessment window when compared with corresponding ground truth area with the sieve distance to change increasingly. The sieve distance that can effectively get rid of class speckles in the assessment window will be used for the whole studied region.
Classification Accuracy Assessment Method
There are two kinds of land use types both in the classification result and the ground truth data. The two images will be compared pixel by pixel, the pixel number of forest classified as forest (FtoF), non-forest as non-forest( NFtoNF), forest as non-forest (FtoNF) and non-forest as forest (NFtoF) will be calculated. The accuracy in percentage can be computed as:
Accuracy(%)=(FtoF+NFtoNF)/(FtoF+NFto NF+FtoNF+NFtoF)*100
Both the classification accuracy before and after classification result post-processing will be shown and analyzed.
Result and Analysis
Classification result based on the ground truth data of Land Use Map
Classification accuracy result before post-processing based on ground truth data of land use map is showed in table 4. From pixel size 50m to 100m, the accuracy increases for both old coherence and new coherence methodology. But the increase step is very small: less then 1.00%. In the view of the effect caused by difference coherence methodology on classification accuracy, we can find that the result of new coherence is lower then that of old coherence by about 1.60% for all the three kinds of pixel size.
From the classification accuracy result after post-processing we can find that from pixel size 50m to 100m, the accuracy decreases for both old coherence and new coherence methodology with one step less then 0.30%. The result of new coherence was still lower then that of old coherence for all the three kinds of pixel size, and the mean difference is 1.48%.
Table 4 Classification Accuracy assessment result based on ground truth data of Land use map (%)
| Pixel Size(m) | 50m | 75m | 100m | |||
| Coherence | OC | NC | OC | NC | OC | NC |
| Before post-processing | 73.344 | 71.747 | 73.824 | 72.226 | 74.709 | 73.045 |
| After post-processing | 76.891 | 75.504 | 76.646 | 75.189 | 76.485 | 74.899 |
Classification result based on ground truth data derived from TM
Classification accuracy result before and after post-processing based on ground truth data derived from TM are showed in table 5. It showed that almost the same change tendency has been observed with the evaluation result based on Land Use Map. That is to say, before post-processing, the accuracy increases with pixel size no matter what kinds of coherence methodology although there is a little difference in the increment step; After post-processing.the accuracy decreased with pixel size. In regard to the effect caused by difference coherence methodology on classification accuracy, we also got consistent result with table 4: the classification accuracy of new coherence was lower then that of old coherence for all the three kinds of pixel size.
Table 5 Classification Accuracy assessment result based on ground truth data derived from TM (%)
| Pixel Size(m) | 50 | 75 | 100 | |||
| Coherence method. | OC | NC | OC | NC | OC | NC |
| Before post-processing | 76.310 | 75.120 | 75.691 | 74.661 | 75.243 | 73.598 |
| After post-processing | 72.986 | 71.738 | 73.187 | 71.928 | 73.555 | 72.094 |
Synthetical Analysis
In order to get reasonable accuracy assessment result, two kinds of ground truth data have been used for this experiment. Among them, the land use map covers the whole Zengcheng County, so the evaluation based on it can be considered as one in larger region. Although much more attention has been paid to control the boundary and type errors during the digitizing and GIS processing from hardcopy of land use map, it was five year older then the currently used SAR data. So we think it is necessary to use one forest map derived from TM image as ground truth data. Because the Landsat TM image, which was acquired almost at the same time with the SAR data, has been carefully selected processed, so we have much more confidence on the authenticity of this TM derived forest and non-forest map then the digital Land Use Map. Since that the same kind of conclusion has been achieved from the two kinds of ground truth data, we think the result we got in this experiment is reasonable and truthfully.
The accuracy assessment result before and after class speckle sieving is inversive in view of the classification effect caused by different pixel size. Before class speckle sieving, classification accuracy increases with the pixel size; After class speckle sieving, it shows the smaller the pixel size is the higher classification accuracy will be got. But in both situations, the accuracy change from one pixel size to another is small. One possible explanation maybe that the low resolution ILU image has high multi-look number, the image speckle on it must be smoothed more seriously than small pixel size, so the class speckle maybe depressed in some way, as a result, the final classification accuracy will be a little higher.
It's impossible and also not applicable to use the raw classification result without class speckle sieving for forest mapping. So we think it is much more appropriate to use post-processed classification result to map forest and non-forest. Although the accuracy increment after post-processing is limited, it is better to use high resolution (low pixel size in some way) for forest and non-forest mapping, specially when we need to produce one large scale land use map.
According to the specification for making photoplan of remote sensing[4] ( see table 8), if SAR image is to be used for making photoplan in the scale of 1:250 000, the ground resolution should not be less then 75m. So 50 m resolution ILU image can be used to generate map with scale to be equal or lower then 1:250 000; 75m and 100 m resolution ILU image can be used to generate map with scale to be equal or lower then 1:500 000. In consideration of this specification, the 50m-pixel-size ILU image is the only choice to generate 1:250 000 forest and non-forest map.
Not only for assessment of three kinds of pixel size but also for that before and after speckle sieving we got the same conclusion that the classification accuracy based on ILU image with new coherence methodology is a little lower then that with ordinary coherence methodology without topography correction. That is to say, there is no need to apply this kind of topography correction as used in this experiment to the IQL System if the ILU image is planed to be used only for forest and non-forest mapping.
Conclusion
There is not so much difference for ILU image with different pixel size to classify forest from non-forest. ILU image with high resolution such as 50m is preferred for forest and non-forest mapping if this kind of data is available. Otherwise image with low resolution such as 100m and 75m can also be used without too much accuracy loss. But if the National Stand: Specification for Making Photoplan of Remote Sensing should be in conformity to, only the 50m ILU image can be used for 1:250 000 forest mapping; The 75m and 100m ILU image can be used for 1:500 000 and 1:1 000 000 forest mapping. There is no need to apply this kind of topography correction as used in this experiment to the IQL System if the produced ILU image is only used for forest and non-forest mapping.
Acknowledgement
All ERS SAR Tandem data have been processed by IQL System at ESA ESRIN. Many thanks to ESRIN staff who help us to obtain and process all ILU images used for this evaluation.
Reference
- Urs vegmüller, Charles L. Werner, 1995, SAR Interferometric signatures of forest, IEEE Trans. Geosci. Remote Sensing. Vol., 33, no. 5, pp. 1153~1161
- Urs vegmüller, C. L. Werner, D. Nüesch, and M. Borgeaud, 1995, Land-surface analysis using ERS-1 SAR interferometry, ESA Bulletin, No. 81, pp. 30-37.
- B. Rosich, Li Zengyuan, “Forest Mapping in China with ERS SAR: Evaluation of Project feasibility and Future Perspectives”, Rev. 1.1, July 1998.
- National standard of People’s Republic of China: Specification for making photoplan of remote sensing, GB 15968- 1995, published in 1995.12.29.