| GISdevelopment.net ---> AARS ---> ACRS 1999 ---> Poster Session 1 |
Satellite SAR Remote Sensing
of Ocean Internal Waves
Zhou Changbao, Yang
Jingsong, Huang Weigen, Fu Bin,
Shi Aiqin, Li Donglin
Second Institute of Oceanography, State Oceanic Administration
Hangzhou, P.R.China
AbstractShi Aiqin, Li Donglin
Second Institute of Oceanography, State Oceanic Administration
Hangzhou, P.R.China
Internal wave is one of important ocean mesoscale phenomena. SAR imaging mechanism of internal wave is very complex and its time-space distribution is of random features. Many scientists are of great interesting in the world on studies of SAR detecting internal wave. In the paper, the present situation and development of internal wave, SAR imaging mechanism and model and so on is introduced briefly at first. The detection and retrieval technology of internal wave is studied in detail. At final the examples of internal wave from SAR images are shown.
Introduction
Internal wave is one of important ocean mesoscale phenomena and of large energies. They are of the great number of destructive power to the buildings on ocean, for examples, marine petroleum platform. The safety of ocean navigation is obstructed, and acoustic propagation courses are disturbed. Produce serious impact to the various marine activities of population. So the happening, growing and change of internal waves are widely followed with interests by scientists of different application department in the world.
In the past, instruments deployed in the ocean internal wave fields have been measured. Like temperature and salinity sensors or current meters. Or by acoustic instruments like sonar, and then, the manifestation of internal wave can be captured by a variety of remote sensing instruments, e.g., by ship radar, ground-based radar and photographic cameral and imaging radar of airborne. Recently, internal wave has been detected by synthetic aperture radar (SAR) from spaceborne for example. ERS-1, Radarsat, SIR-C and so on.
The detection of internal wave is very difficult by SAR due to its imaging mechanism complexity and the random features of time-space distribution. That the ability of SAR to detect internal wave at any weather (cloud cover, storm) and any faces (day and night) as well as high resolution provides the most advanced technique.
Alpers et al (1985, 1994), Lyzenga et al (1988), Wandy and Chambers et al (1997), da Silva et al (1998), Liu et al (1998) have carried out a number of studies on SAR internal wave imaging mechanism, backscattering features, models, main influence factors, measurement technique and typical internal wave images, and so on. Zhao jun sheng et al (1991) have studies internal wave features of China Yellow Sea with routine observation. Changbao Zhou and Weigen Huang (1994, 1996, 1998, 1999) have explored them and all the research make new considerable progresses.
SAR imaging mechanisms and detection model of internal wave
The research results indicate that SAR is an excellent fool to detect internal wave and to estimate solution wavelengths with a good degree of precisian.
Ocean internal waves are often visible in SAR images. The manifestations of internal waves can be summarized as: (a) Their propagation in wave groups or packets with four to ten crests per-groups and forward offshore direction. (b) The crests and trough are often parallel to the bottom topography or else radiate out as if from a source point or region. Wavelength between right and dark bands is about 200m to 1600m. (c) The separate groups of wave are typically tens to a hundred kilometers apart. (d) The crests (or surface manifestation of a constant-phase line) are usually tens to hundreds of kilometers long and very often the lengths of crests (as revealed on image) decrease forward the rear of wave group. (e) These internal waves appear either as dark in a right background (presumably under rough-sea conditions). As right in a dark background (calmer conditions), or as dark and right bands in the intermediate case, suggesting the internal wave can be imaged over a broad range of wind conditions.
It is known, internal waves come in many sizes, shapes, and frequencies, and it is only small subset of these, which appear to be imaged.
SAR imaging of internal wave is attributed to variation in the short-scale surface roughness induced interaction of ocean currents or tidal flow with abrupt topographic features.
SAR is a sensitive surface roughness sensor. The higher the roughness, the higher is the radar return and the brighter is the image intensity. Internal wave forms are associated with rough and smooth bands and usually appears as bright and dark bands in the images.
According to the first order radar imaging theory (Alpers, 1985), relative variation of the normalized radar cross section (NRCS) associated with internal waves,D s/ s0, is linearly related to the gradient of the surface velocity of the surface convergence:
Where A denotes a positive function that depends on radar wavelength, incidence angle and surface wind velocity. For a linear SAR system,D s/ s0 is equal to the relative variation of the SAR image intensity DI/I0. Thus the variation of SAR image intensity as proportional to gradient of the surface wind velocity

The Detecting technology and retrieval method of internal wave
One of the problems in detecting internal wave signatures on the ocean surface using satellite SAR images lies in distinguishing internal waves from often oceanographic and SAR phenomena. Internal wave look- alike may include natural film, greasier, threshold wind speed areas, wind sheltering by land, rain cells, current shear zones, oil slicks, eddies ships and ship wakes, and upwelling. Among this look-alike, natural film, rain cell, and current shears have been see to represent the largest problems. Therefor, the goal of the studies is to develop an automatic method for internal wave detection and location in which dark qeasilinear period linear with a high probability of being an internal wave packet are automatically identified. The technologies of extracting internal wave information from SAR images are as follows:
- Valuable SAR images was chosen. It's ERS-1 SAR image. Acquired time is on 26 June 1995, 02:29:14GMT. The location is 21045'57"N, 120041'02"E. It's pixel internal is 12.5m. The region size is 100km2 (ERS-1 SAR swatch width is 100km). This is southern part of East China Sea.
- Speckles noises of SAR images are suppressed with new filters that select Kaiser, Hamuring, Hunning and other windows, wavelet transform etc. In order to get high-qualified SAR images with typical internal wave signatures.
- To extract the characteristic parameters of internal wave from SAR
sub images using two-dimensional Fast Fourier transforms (2D-FFT).
Two adjoin sub images are taken from processed ERS-1 SAR image and carried out image spectrum analysis with 2DFFT. The dominant wavelength, means wavelength of internal wave and its propagation direction etc. Geographical parameters can be determined according to spectrum features of internal waves. - Studying the features of internal wave by wavelet transform method,
wavelet analysis method is better than FFT to unsteady and non-periodic
signatures in the dimensional analysis.
The mean wavelengths of internal wave are estimated using wavelet analysis. - Comparison of the results of FFT with that of WT.
Preliminary results of SAR to detect internal waves some preliminary results of applying the proposed method for internal wave detection and location to SAR image containing internal wave patterns are presented.
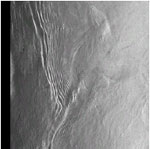
Fig.1 SAR image of internal wave
Fig.2 is two adjoin SAR sub images (a) & (b).
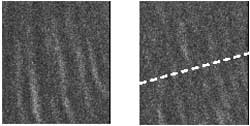
Fig.2 SAR sub image of internal wave
Fig.3 is the results obtained by FFT correspond to Fig.2 (a) & (b).

Fig.3 The direction spectrum of internal waves by FFT
According to direction spectra of internal wave, mean wavelengths are about 872m and 816m, their dominates wavelengths are 708m and 607m respectively. Therefore we can decide the propagating direction is from western to eastern.
Fig.4 shows the results obtained by wavelet transform of Symmlet and Danbedies to Fig.2 (b). Table 1 is various layer of physical scale and normalized deflection results expend from wavelet basis of internal wave section. From Table 1, we can see that 6th layer maximizing deflection is maximum. The mean wavelength of internal wave corresponding to 6th layer section is about 800m.
Fig.4 Wavelet basis expend of internal wave section
Table 1. Various expended physical scale and normalized
deflection expended by wavelet basis of internal wave section
| Laye r(j) | scale (m) | Normalized s 0 (Symmlet) | Normalized s 0 (Daubechies) |
| 8 | 3200 | 0.0267 | 0.0878 |
| 7 | 1600 | 0.0044 | 0.0159 |
| 6 | 800 | 0.4565 | 0.3620 |
| 5 | 400 | 0.2166 | 0.1163 |
| 2 | 50 | 0.0280 | 0.0448 |
| 1 | 25 | 0.0375 | 0.1097 |
| 4 | 200 | 0.1748 | 0.1691 |
| 3 | 100 | 0.0555 | 0.0944 |
Conclusion and Discussion
SAR imaging mechanism of internal waves is very complex. The imaging includes the interactions of surface wave and waves, waves and currents as well as current and bottom topography. Of them, the interaction of current fields induced by internal wave and surface waves induced by wind fields is mail contributed factors, particularly, high and low of wind speed is a key factor to detect internal wave by SAR.
Wavelet transform is a new method to study internal wave, particularly unsteady non- periodic signal signatures of internal wave. FFT is also a efficient methods to quasilimear and periodic signal signature.
The technologies combined FFT with wavelet transform presented by us are applied to analyze the manifestation of internal wave. Comparing the results of both methods gets the geophysical parameters. For example, for choose SAR image, the wavelength of internal wave is about 800m, and the propagating detection is from western to eastern.
In future, dominating research areas include SAR imaging mechanism and information extraction as well as determination of characteristic parameters from SAR images.
Acknowledgment
The authors would like to thank Dr Ming K. Hsu. Taiwan University of Oceanography, Taiwan, China for us providing the ERS SAR images, and would like to thank 863- 818 program.