| GISdevelopment.net ---> AARS ---> ACRS 1999 ---> Poster Session 1 |
Analysis of Water Quality
Pattern near the Lake Hinuma using Passive Image Data
Takashi Hoshi
Department of the Computer and Information Sciences.
Faculty of Engineering, Ibaraki University
Tel (81)-294-38-5133,Fax(81)-294-38-5282,
E-mail: hoshi@cis.ibaraki.ac.jp
Kazuhito Tanii
Graduate School of Science and Engineering, Ibaraki University
E-mail: tanii@cis.ibaraki.ac.jp
Abstract Department of the Computer and Information Sciences.
Faculty of Engineering, Ibaraki University
Tel (81)-294-38-5133,Fax(81)-294-38-5282,
E-mail: hoshi@cis.ibaraki.ac.jp
Kazuhito Tanii
Graduate School of Science and Engineering, Ibaraki University
E-mail: tanii@cis.ibaraki.ac.jp
The lake Hinuma is receiving the effect of the coastal water as it is close to the ocean. Therefore the aquatic environment unlike general freshwater lake is shown. In this research, water quality pattern of the lake Hinuma was analyzed using satellite image data from the passive sensor. This paper describes results of the image classification and the principal component analysis in the Hinuma region.
Introduction
Lake Kasumigaura area (167.6km 2 ) is located in the Ibaraki Prefecture of Japan (1), and is taken seriously as a source of the water use, because it is used for the drinking water. In case of Hinuma water system, it is not suitable for drinking and the scale is small, so it is not noticed in comparison with the lake Kasumigaura. The lake Hinuma in Ibaraki Prefecture flows into the coast along the Pacific Ocean from Nakagawa River. The environment of soil, vegetation and crops have changed delicately in the water system in river, lakes and marshes along to the coast in order to receive the influence of the salinity. The utilization of image data of remote sensing has also handled to the result of small-scale from the large scale. Though environment around the lake Hinuma is not very much noticed up to now, at present it should be also noticed in every region. First, this is analyzed by the collection of field study data for the lake Hinuma in Ibaraki Prefecture. Next, the pattern classification is carried out using satellite image data extracted from the passivity sensor. One of the advantages of image data of remote sensing is to make possible to observe simultaneously wide area. This technology is effective for pattern analysis of water current object that changes every moment. Maximum likelihood method of the supervised classification and Ward’s method of the unsupervised classification is used for the classification technique. The results of the pattern classification of satellite image are compared and are examined while result of statistical analysis of this field information is made to reference. Elements of the water quality for the statistical analysis of field information of the lake Hinuma are water temperatures, water depth, turbidity, salinity, dissolved oxygen, COD, etc. Except for these, the variable of clay, silt, sand, moisture, specific gravity and all nitrogen is also used for the statistical analysis in respect of the soil test of the sediment change. The study area of chapter 2, the analysis of water quality data of chapter 3, the sediment of Hinuma of the chapter 4, and analysis method of existing field study data are described. The chapter 5 describes thematic map preparation near the lake Hinuma using the remote sensing technique. Classification pattern of this thematic map examines if there is any relation with the existing result of data analysis.
The study area
Shishido river water empties into Lake Hinuma, and it can not be measured the degree of the inflow in the river with the small scale. The runoff from Lake Hinuma flows in Nakagawa River, and then, it flows into the coast. In this reason, the lake water is not used for drinking water in order to include the thin salinity. There is a field of algae in Lake Hinuma, and it is nutritional lake that becomes a field of egg-laying and water fish rearing of the fish. The major features is as follows, area : 9.4km 2 , lake length : 20km, average water depth : 2.1m, water surface altitude : 0m. The water depth observation was carried out using a sound locator and GPS in the early 1997. The geologic profile was made from field study and existing holing materials. The temperature of surface water was measured at 20cm depth from the water surface. Then, water temperature of the low rise water was measured from the lake bed in 20cm place. Turbidity, dissolved oxygen, electric conductivity data except for the water temperature was also measured from the material that sampled water from two points of surface water and lake bed of the superscription in shipboard. Soil test is analyzed by the bottom sediment survey of moisture, water specific gravity and grain size pattern. These data are mainly used for statistical analysis.
The analysis of water quality data
The water depth of the lake Hinuma
To survey the water depth, 150 sites are selected from 9.4km 2 area of the Lake Hinuma, and it was carried out by Mr. Ohshima et al. The water depth contour line was obtained on the basis of this water depth data. This is shown in the map of the 1/20,000 scale (Figure-1).
The correlation coefficient between water quality variables
The data of the water surface and bottom by 18 sites in Lake Hinuma was observed in the ebb tide in May 1997. The observing data types are water temperatures, water depth, turbidity, dissolved oxygen, COD, electric conductivity, salinity and transparency. From these, the correlation coefficient between 5 variables of water temperature, water depth, turbidity, dissolved oxygen (DO) and COD was obtained. Correlation coefficients between main variables are as follows (2)
- EC-COD and water temperature -DO (0.75³r³0.70)
- DO-turbidity (r = -0.63)
- water temperature-turbidity and water depth –DO (r=-0.49)
- water depth - turbidity, water depth - water tempera-ture, water depth - COD and water depth - EC (0.43³ ½r½ ³0.32)
- COD....water temperature (r=0.23)
- EC-water, EC-temperature, EC-DO, EC-turbidity and turbidity -COD (0.10³½r½³0.02)
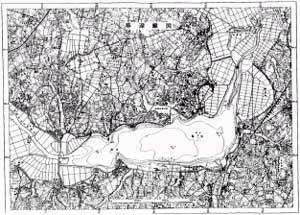
Fig.1 Water depth map of the Lake Hinuma
The principal component analysis
Main component score of surface water and bottom layer water was plotted in the Z1-Z2 plane, because 70% at accumulation contribution ratio of primary main component (Z1) and second main component (Z2) were exceeded. As this result, it is divided into three groups of fresh water effect area:a1, stagnation brackish water:a2, salt water effect area:a3. Figure-2, 3 shows these three groups of a1,a2 and a3 in Lake Hinuma map.
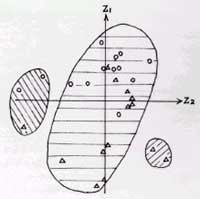
Fig.2 Samples to plotted in the Z1,Z2 plane
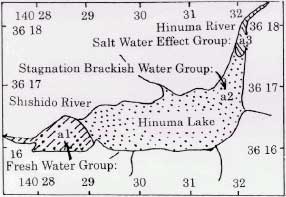
Fig.3 Groups of a1-a3 in Lake Hinuma
The sediment of Hinuma
The soil data analysis
The measurement of the specific gravity and moisture, and particle size distribution test were carried out after the picking material aired. Then, the element of the statistical analysis was processed by six variables in addition to clay, silt and sand which were the composition element of the soil, in addition to moisture, specific gravity and all nitrogen. It is calculated by the correlation coefficients between six variables of the clay, silt, sand, moisture, specific gravity and all nitrogen.
Correlation coefficient between soil variables
The correlation coefficients between main variables are as follows.
- clay-silt (r=-0.82), all nitrogen-moisture (r=0.74)
- clay-all nitrogen, sand-moisture (r=0.63)
- sand-all nitrogen (r=0.58)
The principal component analysis
The principal component analysis is tried on the variable of the pelitic sediment (3). Primary main component (Z1) and second main component (Z2) that exceeded 80% at the accumulation contribution ratio were adopted. It was divided into 3 groups by the plotting of the main component score on the Z1....Z2 plane. The ratio of coarse grain sediment of the sand and silt is big for first group Gs1, and there are features of which all nitrogen and moisture are comparatively small. Second group Gs2 and third group Gs3 has the contrary property to the first group Gs1.
It is the characteristic of second group Gs2 that mud quantity, all nitrogen and moisture, etc. are big. These of third group Gs3 are comparatively small. These group Gs1, Gs2 and Gs3 are shown in Figure-4.
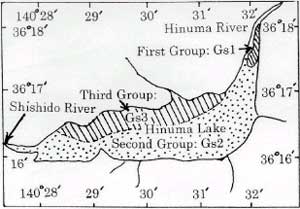
Fig.4 Result ofthe principal component analysis
Satellite image and the classification result
The utilization image
As satellite image data from the passivity sensor, Landsat·TM data in the Ibaraki Prefecture area in Japan is used. This image data are extracted on 24 Apr. 1994, and it is a scene of path 107-row35 and 0% cloud amount.
CCT value of water area.
Training area of assumed 6 sites was selected from water area in the image analysis district. The difference of mean CCT value of these training area affects to the evaluation of the classification. The almost equal class of the mean value of CCT value is arranged, and Table-1 is made.
Table-1 Distribution of the band data in water areas
| water area | Band 1 | Band 2 | Band 3 | Band 4 | Band 5 | Band 6 | Band 7 |
| NO.1 | 92.5 | 35.5 | 34.1 | 20.2 | 14.1 | 117.7 | 6.7 |
| NO.2 | 98.1 | 40.1 | 40.1 | 24.8 | 18.5 | 122.3 | 8.8 |
| NO.3 | 92.7 | 38.9 | 40.1 | 25.5 | 19.4 | 128.1 | 8.6 |
| NO.4 | 94.3 | 30.9 | 39.7 | 26.6 | 19.1 | 130.1 | 8.6 |
| NO.5 | 97.3 | 40.2 | 41.1 | 26.5 | 19.1 | 128.4 | 8.7 |
| NO.6 | 97.7 | 41.1 | 43.3 | 29.2 | 20.9 | 131.7 | 9.3 |
Next, there is seldom difference of CCT value of band 1 and band 7 as the result of examining the CCT value with band data of each class. Then, the classification was carried out next selected bands.
1) Band 1, 2,3, 4, 5, 7 3) Band 2, 3, 4, 5
2) Band 2, 3, 4, 5, 6
Thematic map preparation by these band variables is carried out by remote sensing analysis system of RSIPS[4].
The image classification result
Waters in Lake Hinuma, Nakagawa River and coastal zone have been classified into six kinds. Clustering processing of a round robin inspection needs a long time. So the clustering uses sampling mesh data instead of all pixel data of study area. The sampling mesh data number was made to increase from 250, and test of the clustering was carried out. The sampling mesh data number was increased till about 450 and classification result was stabilized. The selectivity of superscription variable is examined from the classifi-cation result of waters. Referring to the pattern of this classification result, the high similarity training district selected 12 classification items from study area (4). In making this training district to be the supervised data, the classification was applied to the satellite image data for the purpose of water area in the lake Hinuma, Nakagawa River and coast. This result is shown in Figure-5. The classification map was output by the application of maximum likelihood method (MLHM). Figure-6 is this classification result.
Discussion
Sea surface area is divided into 2 layers when the relation of the classified pattern of the water system of LANDSAT satellite image data by remote sensing technique and water depth. The lake Hinuma water and the Nakagawa River water were distinguished. It is possible to distinguish the lake Hinuma water to suicidal drowning and effluent area and lake area of Shishido river. The complicated pattern property is shown near the center in the lake, and the classification result changes by selection position of the training area, and stabilizing pattern property is not shown. It is difficult to under-stand the complicated pattern property near the center of the lake by satellite image data analysis in a time.
Conclusion
The analysis becomes easy, if the part of business work analyzed from existing material and drawing and field study data is simplified by the new technique. Until now, the situation of surficial extension and distribution pattern has been easy to understand by diagrammatizing characteristic group got from the principal component analysis of the 3, 4 chapter. This pattern situation may be replaced to the investigation of the remote sensing from the sky (5) under the expectation of the superscription. The classification technique of remote sensing was applied to image datum. This result is as follows. Shishido river effects category is classified as class A of Lake Hinuma water system. It was also possible to find its boundary. This is correspondent to group a1 shown in the water quality data analysis. The Hinuma watershed is interpreted as effect category class B of the coastal water.
This is corresponded to group a3 of the water quality data analysis. The Hinuma watershed is understood as effect category class B of the coastal water. This is corresponded to group a3 of the water quality data analysis. It is not possible to show clear boundaries near the center of the lake for the complicated pattern property such as class C and D. This is corresponded for group a2 of the water quality data analysis and group of Gs2 and Gs3 of the soil analysis. The pattern in the sea water area in the coast is classified into the 2 classes. Class F is the deep water, and class E is the shallow water depth area in the effect category of the running water of Nakagawa River.
Reference.
- National Astronomical Observatory (1998): Chronological Scientific Table’98, Maruzen,pp.662-663.
- Yukio Asuma, Horie, M. Ishii, T. Miura, K. and Ohshima, K(1998):Environment Resources of Ibaraki Prefecture Hinuma, Region Integrated Lab. of Ibaraki Univ., pp.1-21.
- Noboru Ohsumi (1989): Statistical Data Analysis and Software, Education Promotion Association of Broadcasting University, pp.116-136.
- Takashi Hoshi(1979) : Processing System “USAS” of MSS Data from an Aircraft and It’s Application, Published in the Proc. of JSCE ,No.285, pp.69-83.
- D J Maguire, M. F Goodchild and D. W Rhind (1991):Geographical Information Systems: Principles and Applications,,Longman Group UK Limited, Sec.14.
- Kazuhito Tanii and Takashi Hoshi (1999) : Useful of unsupervised classification residual image using RSIPS, Proc. 58th annual conference of IPSJ,1-D,pp.2-17~18.
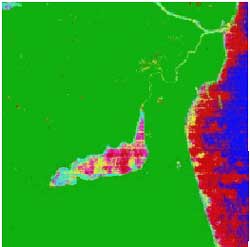
Fig.5 The classification result of Ward's method
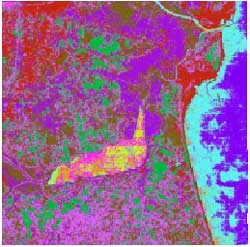
Fig.6 Classification result of MLH method