| GISdevelopment.net ---> AARS ---> ACRS 1999 ---> Oceanography/Coastal Zone |
A Robust System for Shoreline
Detection and its Application to Coastal-zone Monitoring
Li-Yu Chang, A. J. Chen, C.
F. Chen, C. M. Huang
Center for Space and Remote Sensing Research,
National Central University, Chung Li, CHINA TAIPEI
Tel: 886-3-4227151-7688, Fax: 886-3-4254908
E-mail: lychang@csrsr.ncu.edu.tw
AbstractCenter for Space and Remote Sensing Research,
National Central University, Chung Li, CHINA TAIPEI
Tel: 886-3-4227151-7688, Fax: 886-3-4254908
E-mail: lychang@csrsr.ncu.edu.tw
The measurement of shoreline is a key factor in coastal-zone construction. The traditional ground survey is time and cost consuming. In this study, we propose a automatic scheme to detect shoreline for SPOT multi-spectral images. This scheme contains two stages. Firstly, we convert the color model of image representation from RGB to ISH and then use the ISODATA to classify saturation information to obtain the areas that contain the potential tideland information. Secondly, we use the hue information to refine the tideland areas and retrieve the shoreline. The test result shows that the proposed scheme is useful and practical.
Introduction
The estimation of shoreline is very important for the coastal construction. To construct a facility near coastal area we need to realize the short-term(several weeks) and long-term(several years) variation of shoreline about area of tideland. Traditionally, using ground survey to measure the position of shoreline is labor intensive and time consuming. Because of the vast ground coverage and highly temporal resolution of SPOT satellite, it is both time and cost effective to use SPOT multi-spectral images to detect shoreline, even though the positioning accuracy is poorer than ground survey due to its the 20m resolution.
It is very difficult to automatically identify the tideland from SPOT images if we use image classification techniques. The main reason is that they normally need some sample information as training data for supervised classification or as references to assign class for unsupervised classification. In this study, we develop an automated scheme to delineate tideland from multi-spectral SPOT image and then obtain shoreline.
Method
SPOT multi-spectral images contain 3 spectral bands. These bands cover green(0.50~0.59mm, band 1), red(0.61~0.68mm, band 2) and near infrared(0.79~0.89m m, band 3). In general, there are many color models to represent a color image. Normally, RGB color model is used to represent SPOT images. For example, we use the gray scales of red, green, and blue color to display band 3, band 2 and band 1 of a multi-spectral SPOT image, respectively. In this study, we use another color model, ISH[ 1], to represent SPOT satellite images. The formula to convert RGB to ISH is as follows:
If M = m, S = 0 (2)
If M = m, H = 0 (8)
If R = M, H = 60(2+b-g) (9)
If G = M, H = 60(4+r-b) (10)
If B = M, H = 60(6+g-r) (11)
By inspecting the saturation(S) of SPOT images, it can be found out that there are value gaps between sea water, tideland and land areas. The relation of saturation value between these classes can be expressed as:
Ssea>Stideland>Sland area (12)
Then, we can use ISODATA unsupervised classification method to classify the saturation image into 3 clusters. Accordingly, the cluster that has the mean in the middle can be identified as the potential tideland areas. The cluster has maximum mean is categorized as the sea areas. The last one with a minimum mean is classified as the land areas.
Since some land areas may be misclassified as the tideland, the potential tideland obviously need further refinement. In this study, the hue(H) image is used to implement the refinement, because the following characteristic can be found:
Hsea & tideland > Hland area
In the following stage we classify hue image into 2 clusters using ISODATA. Following the classification, we can use the classified land area from hue image as a mask to wipe off the misclassied area from potential tideland area as a refinement procedure. Finally, we clump refined tideland area into patches and select the patches adjacent to sea area as tideland. Then, we can extract the edge[ 2] of tideland areas as the shoreline.
Test Data and Results
Figure 3.1 is a SPOT multi-spectral image acquired on Nov. 12, 1998. It is a shelf near western coast of Taiwan. The red line is detected shoreline by proposed scheme. The yellow line is a ground survey result using DGPS(Differential Global Positioning System) at the same time with the accuracy under one meter. The error checking positions are indicated as green segments. Table 3.1 is the error of each segment.
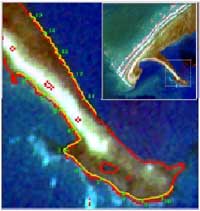 Figure 3.1 Test SPOT images. |
Table 3.1 Error of each segment.
|
From table 3.1, the error is around one image pixel. This result illustrates the practicability of proposed scheme. In figure 3.2, a series of SPOT images acquired during Nov. 1 and Nov. 12, 1998. The location of these images is the southern coast of Taichung Harbor. In this period, the sea level varies from 85.8cm to 515.6cm. Figure 3.3 shows the detected shorelines and demonstrates the contours of tideland.
 | ||
11/03/1998, 515.6cm |
11/02/1998, 451.3cm | 11/01/1998, 339.3cm |
 |
||
11/12/1998, 125.8cm |
11/11/1998, 85.8cm | |
Figure 3.3 The detected shorelines of tideland.
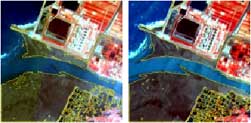
Figure 3.4 is two SPOT images at a time interval of 5 years over Taichung Harbor. Their sea levels are 122.7cm and 125.8cm, respectively. Figure 3.5 demonstrates the time variation of the tideland over the same area.
 | |
12/08/1993, 122.7cm |
11/12/1998, 125.8cm |
Figure 3.4 Two SPOT images at a time interval of 5 years and their sea levels. | |
Figure 3.5 The time variation of the tideland over the same area.
Conclusion
From the comparison of detected shoreline and ground survey, the results illustrate the proposed scheme is capable of detecting shoreline automatically.
Obviously, if a series of images within a short period of time can be collected, we can delineate contours of the tideland. Accordingly, if a series of images with their time interval is long enough and the sea levels are similar, we can detect the variation of tideland. From the result of the test data shows that the tideland of the southern coast of Taichung Harbor is shrinking.
Reference
- Conrac Corp., “Raster Graphics Handbook”, Conrac Division, 1980.
- Rafael C. Gonzalez and Richard E. Woods, “Digital Image Processing”, Addsion-Wesely, 1992.